Mappedin Print
Bridging digital and physical wayfinding with automatically generated, print-ready maps.
- When
- 2018–2019
- Where
- Mappedin
- What I did
- Product design, User research, User testing, Prototyping
Outcomes
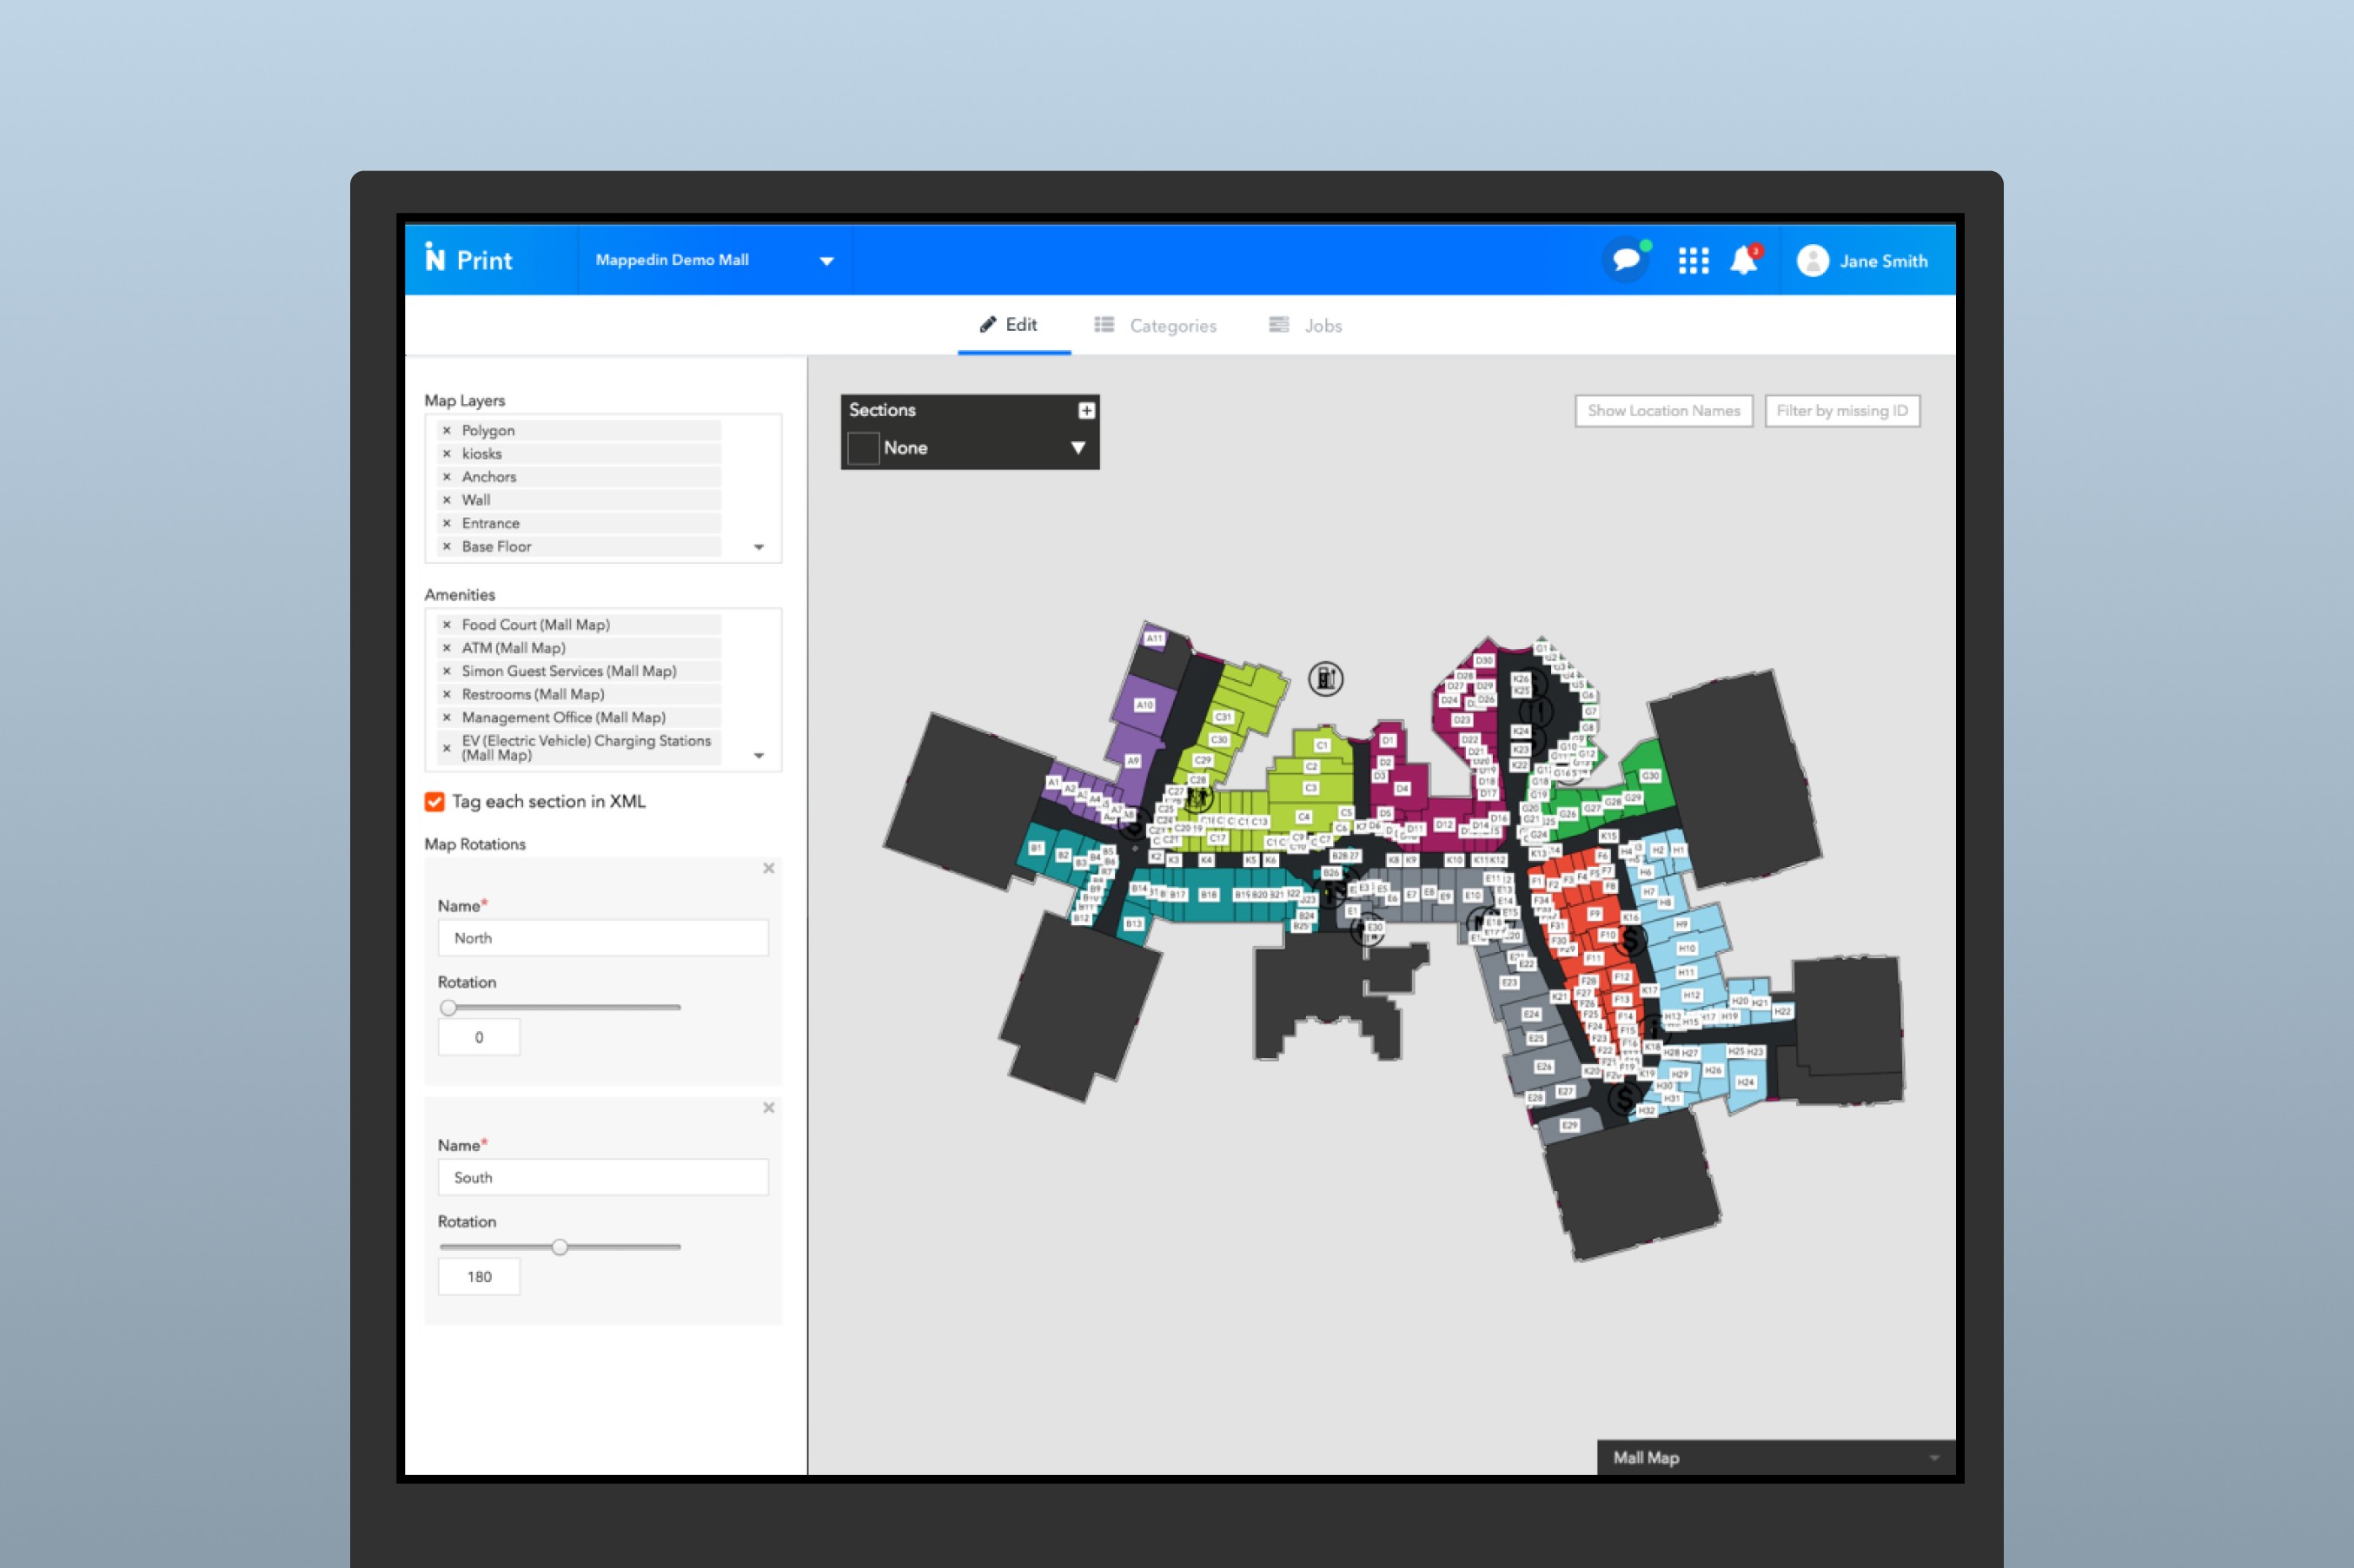
- Cut print-map production time in half compared with the previous workflow.
- Reduced customer costs by removing hours of repetitive external design work.
- Translated a rich digital map system into editable, print-ready output.
Context
Mappedin primarily built digital wayfinding, but many customers still needed physical maps throughout their venues. The existing process converted digital data into print manually. It was slow, expensive, difficult to update, and prone to inconsistencies.
We saw an opportunity to generate high-quality, print-ready maps directly from the customer's existing venue data.
Problem areas
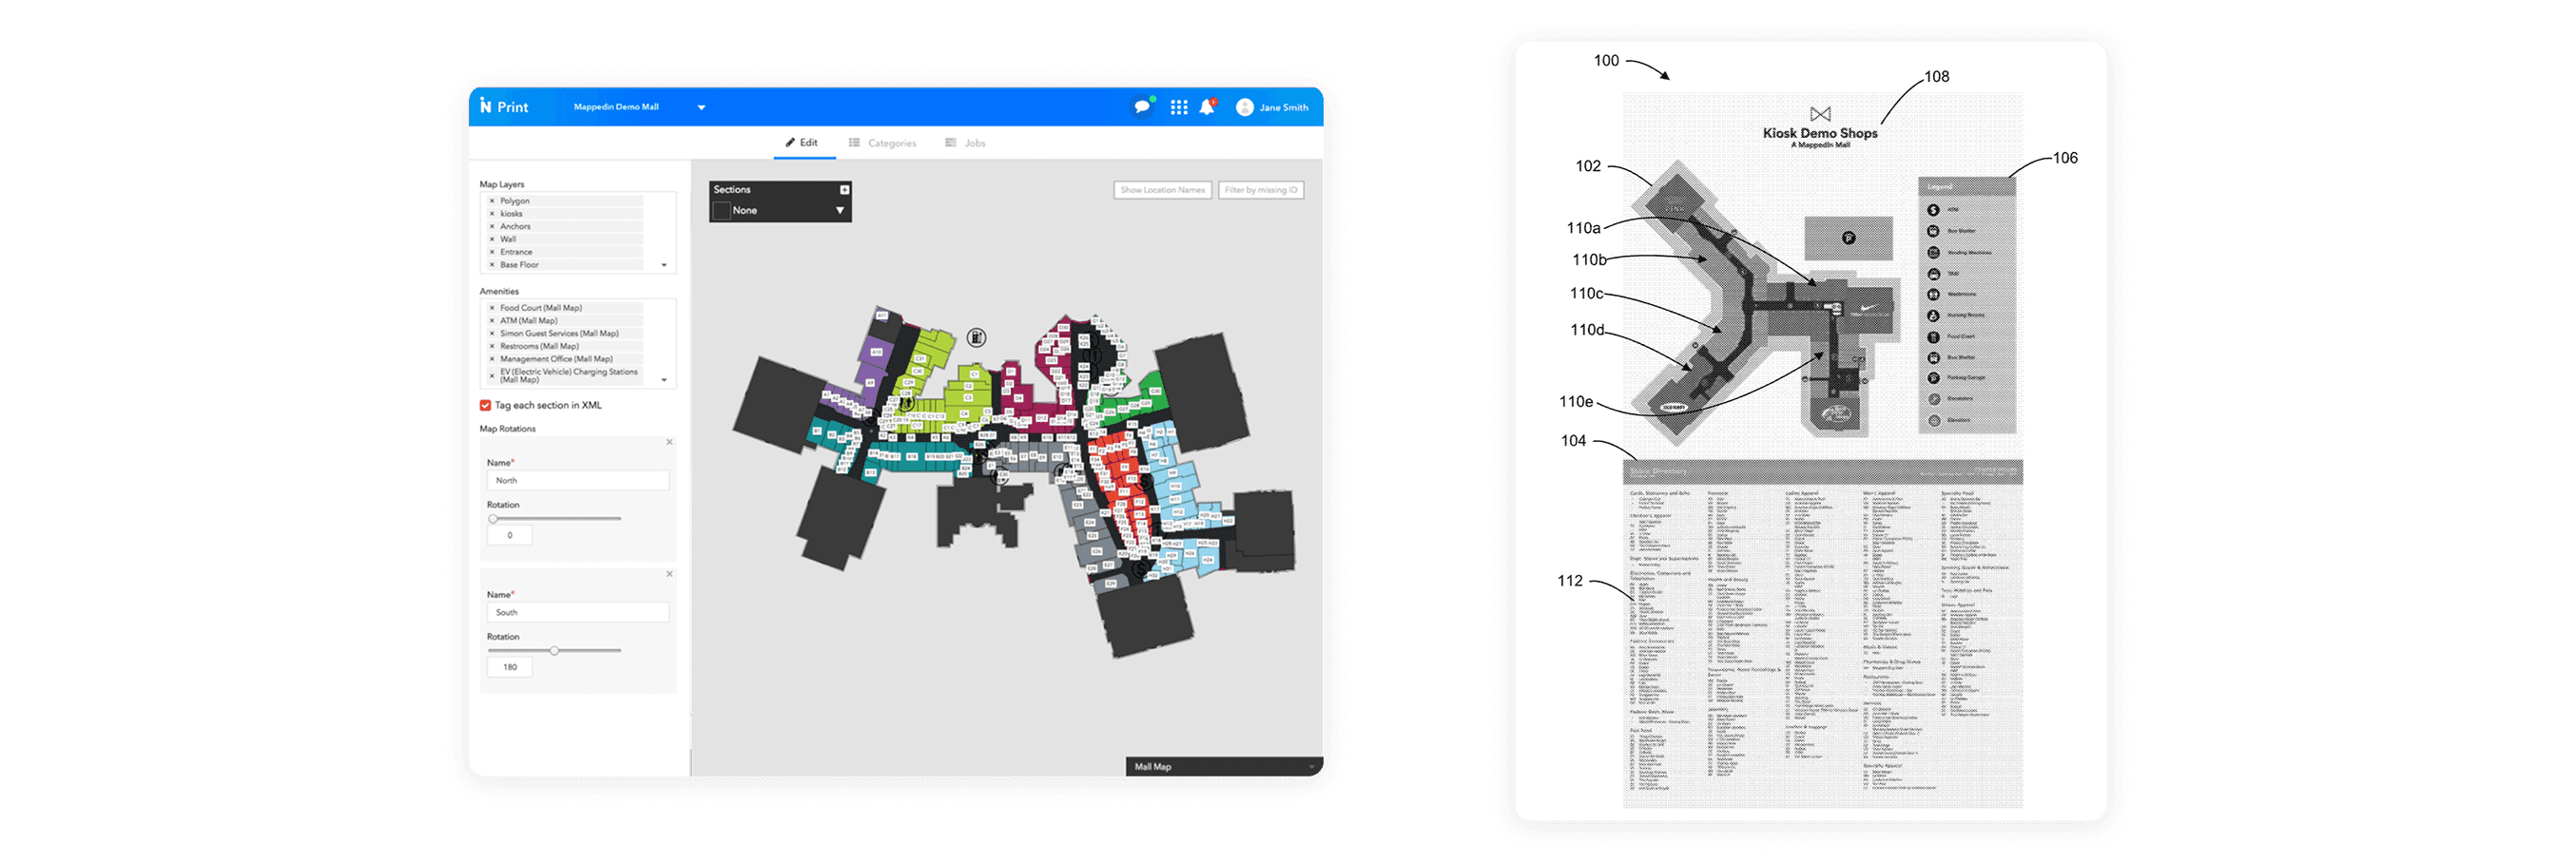
- Producing each print map manually required significant time and external design cost.
- Translating an interactive, zoomable map to a fixed format could reduce clarity and introduce mistakes.
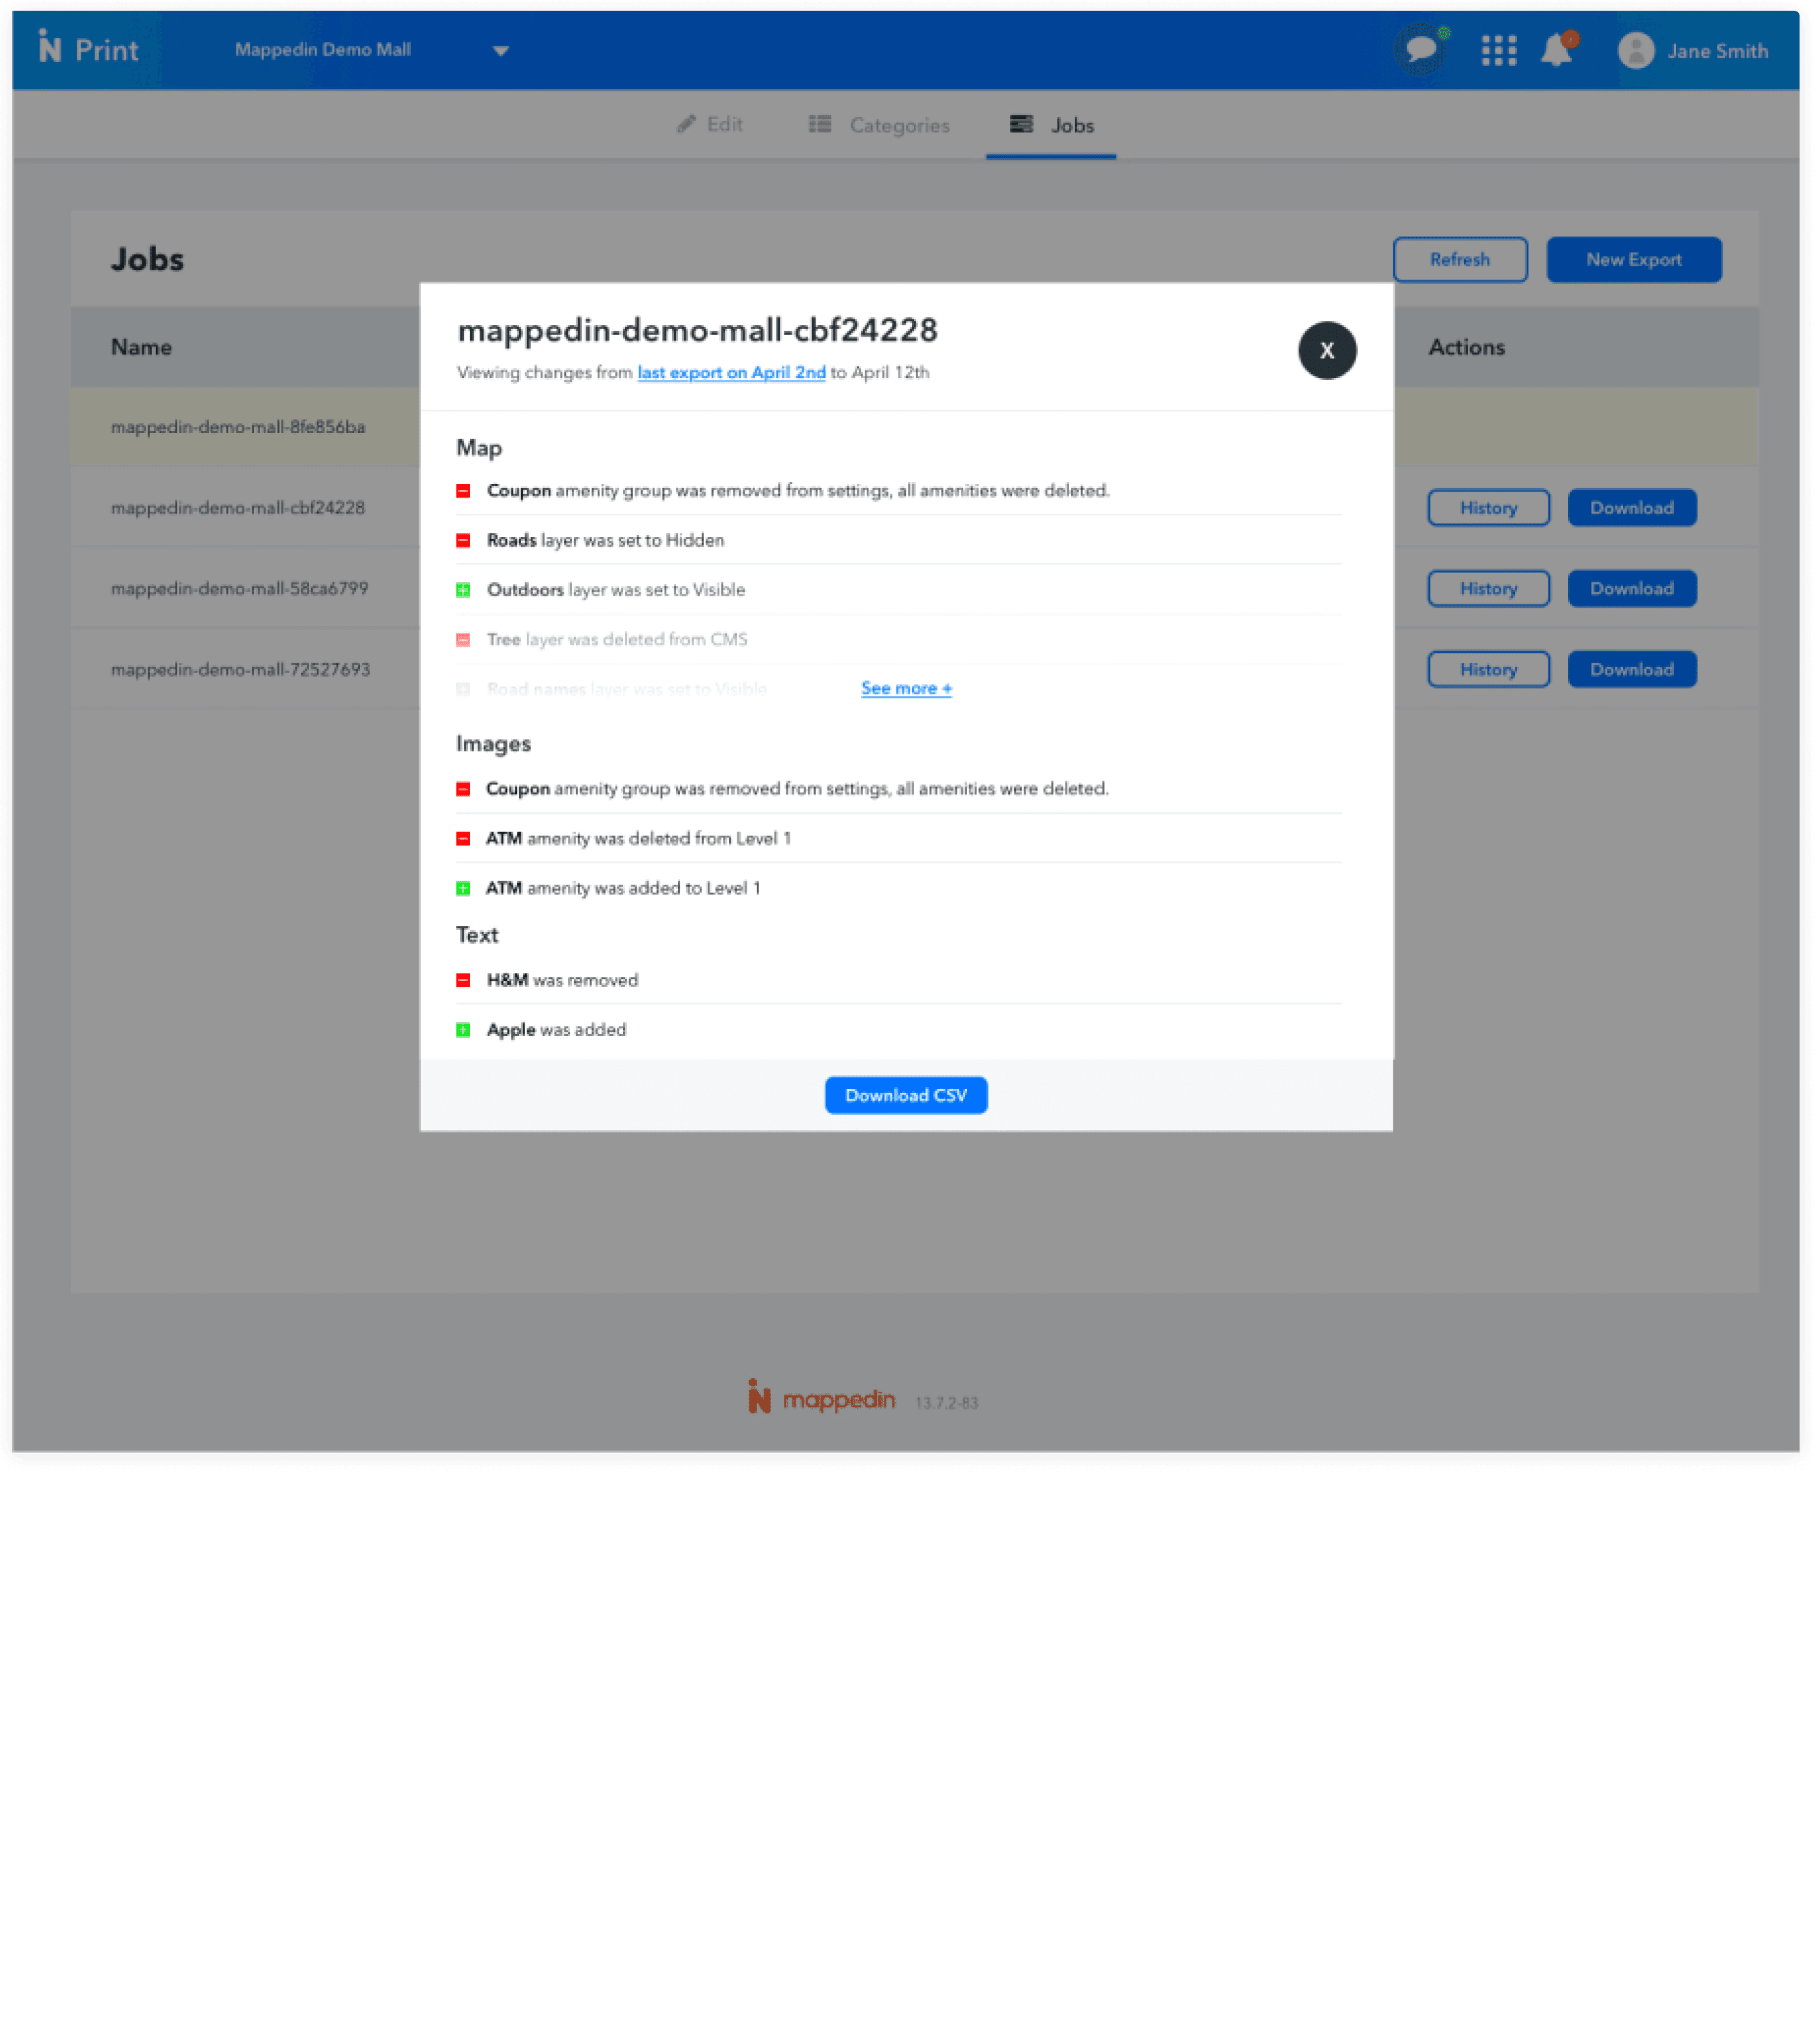
- Every content or venue update created another expensive design cycle.
- The output still needed to work with established production tools such as Adobe InDesign.
The system needed to preserve readability, support different orientations and map layers, and give designers room for final customization without making them rebuild the underlying data.
Design process
Discovery and definition
We researched print systems across mall directories, subway networks, airports, and trail maps, then interviewed customers about their current production workflows and pain points.
Exploration and ideation
We sketched different wayfinding systems and page layouts, focusing on orientation, hierarchy, and how much information a static view could comfortably hold.
Design and prototyping
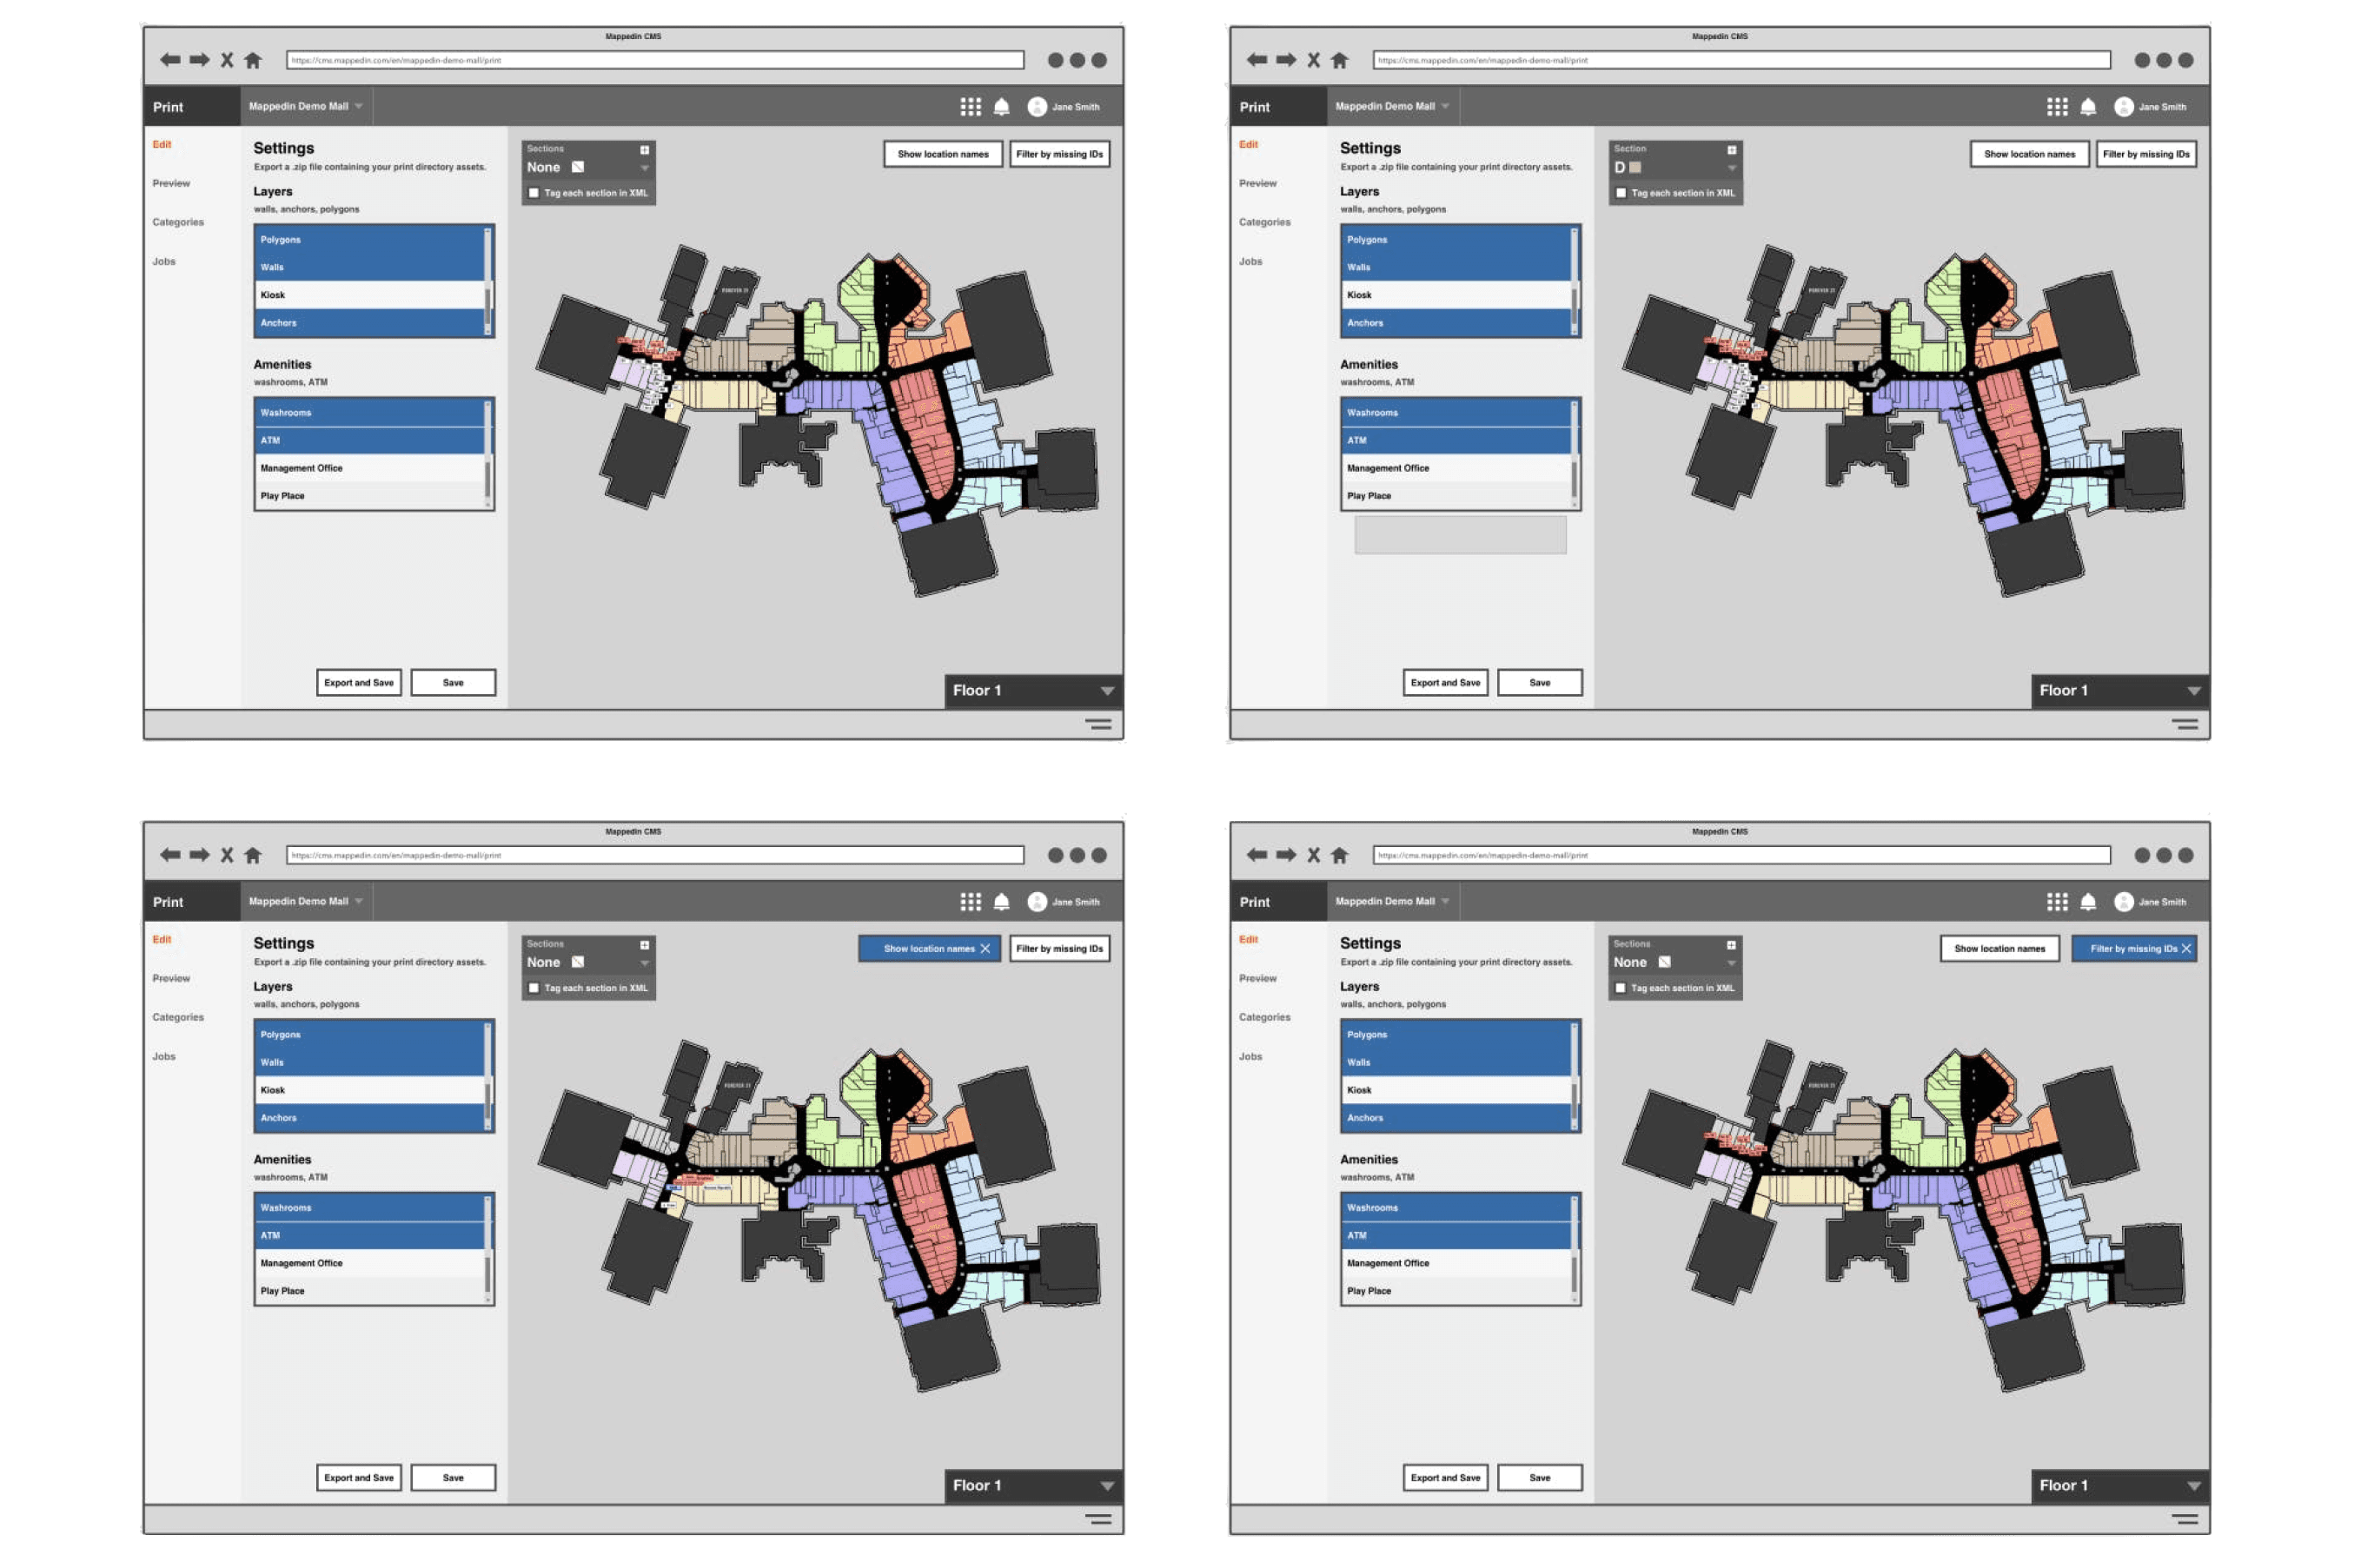
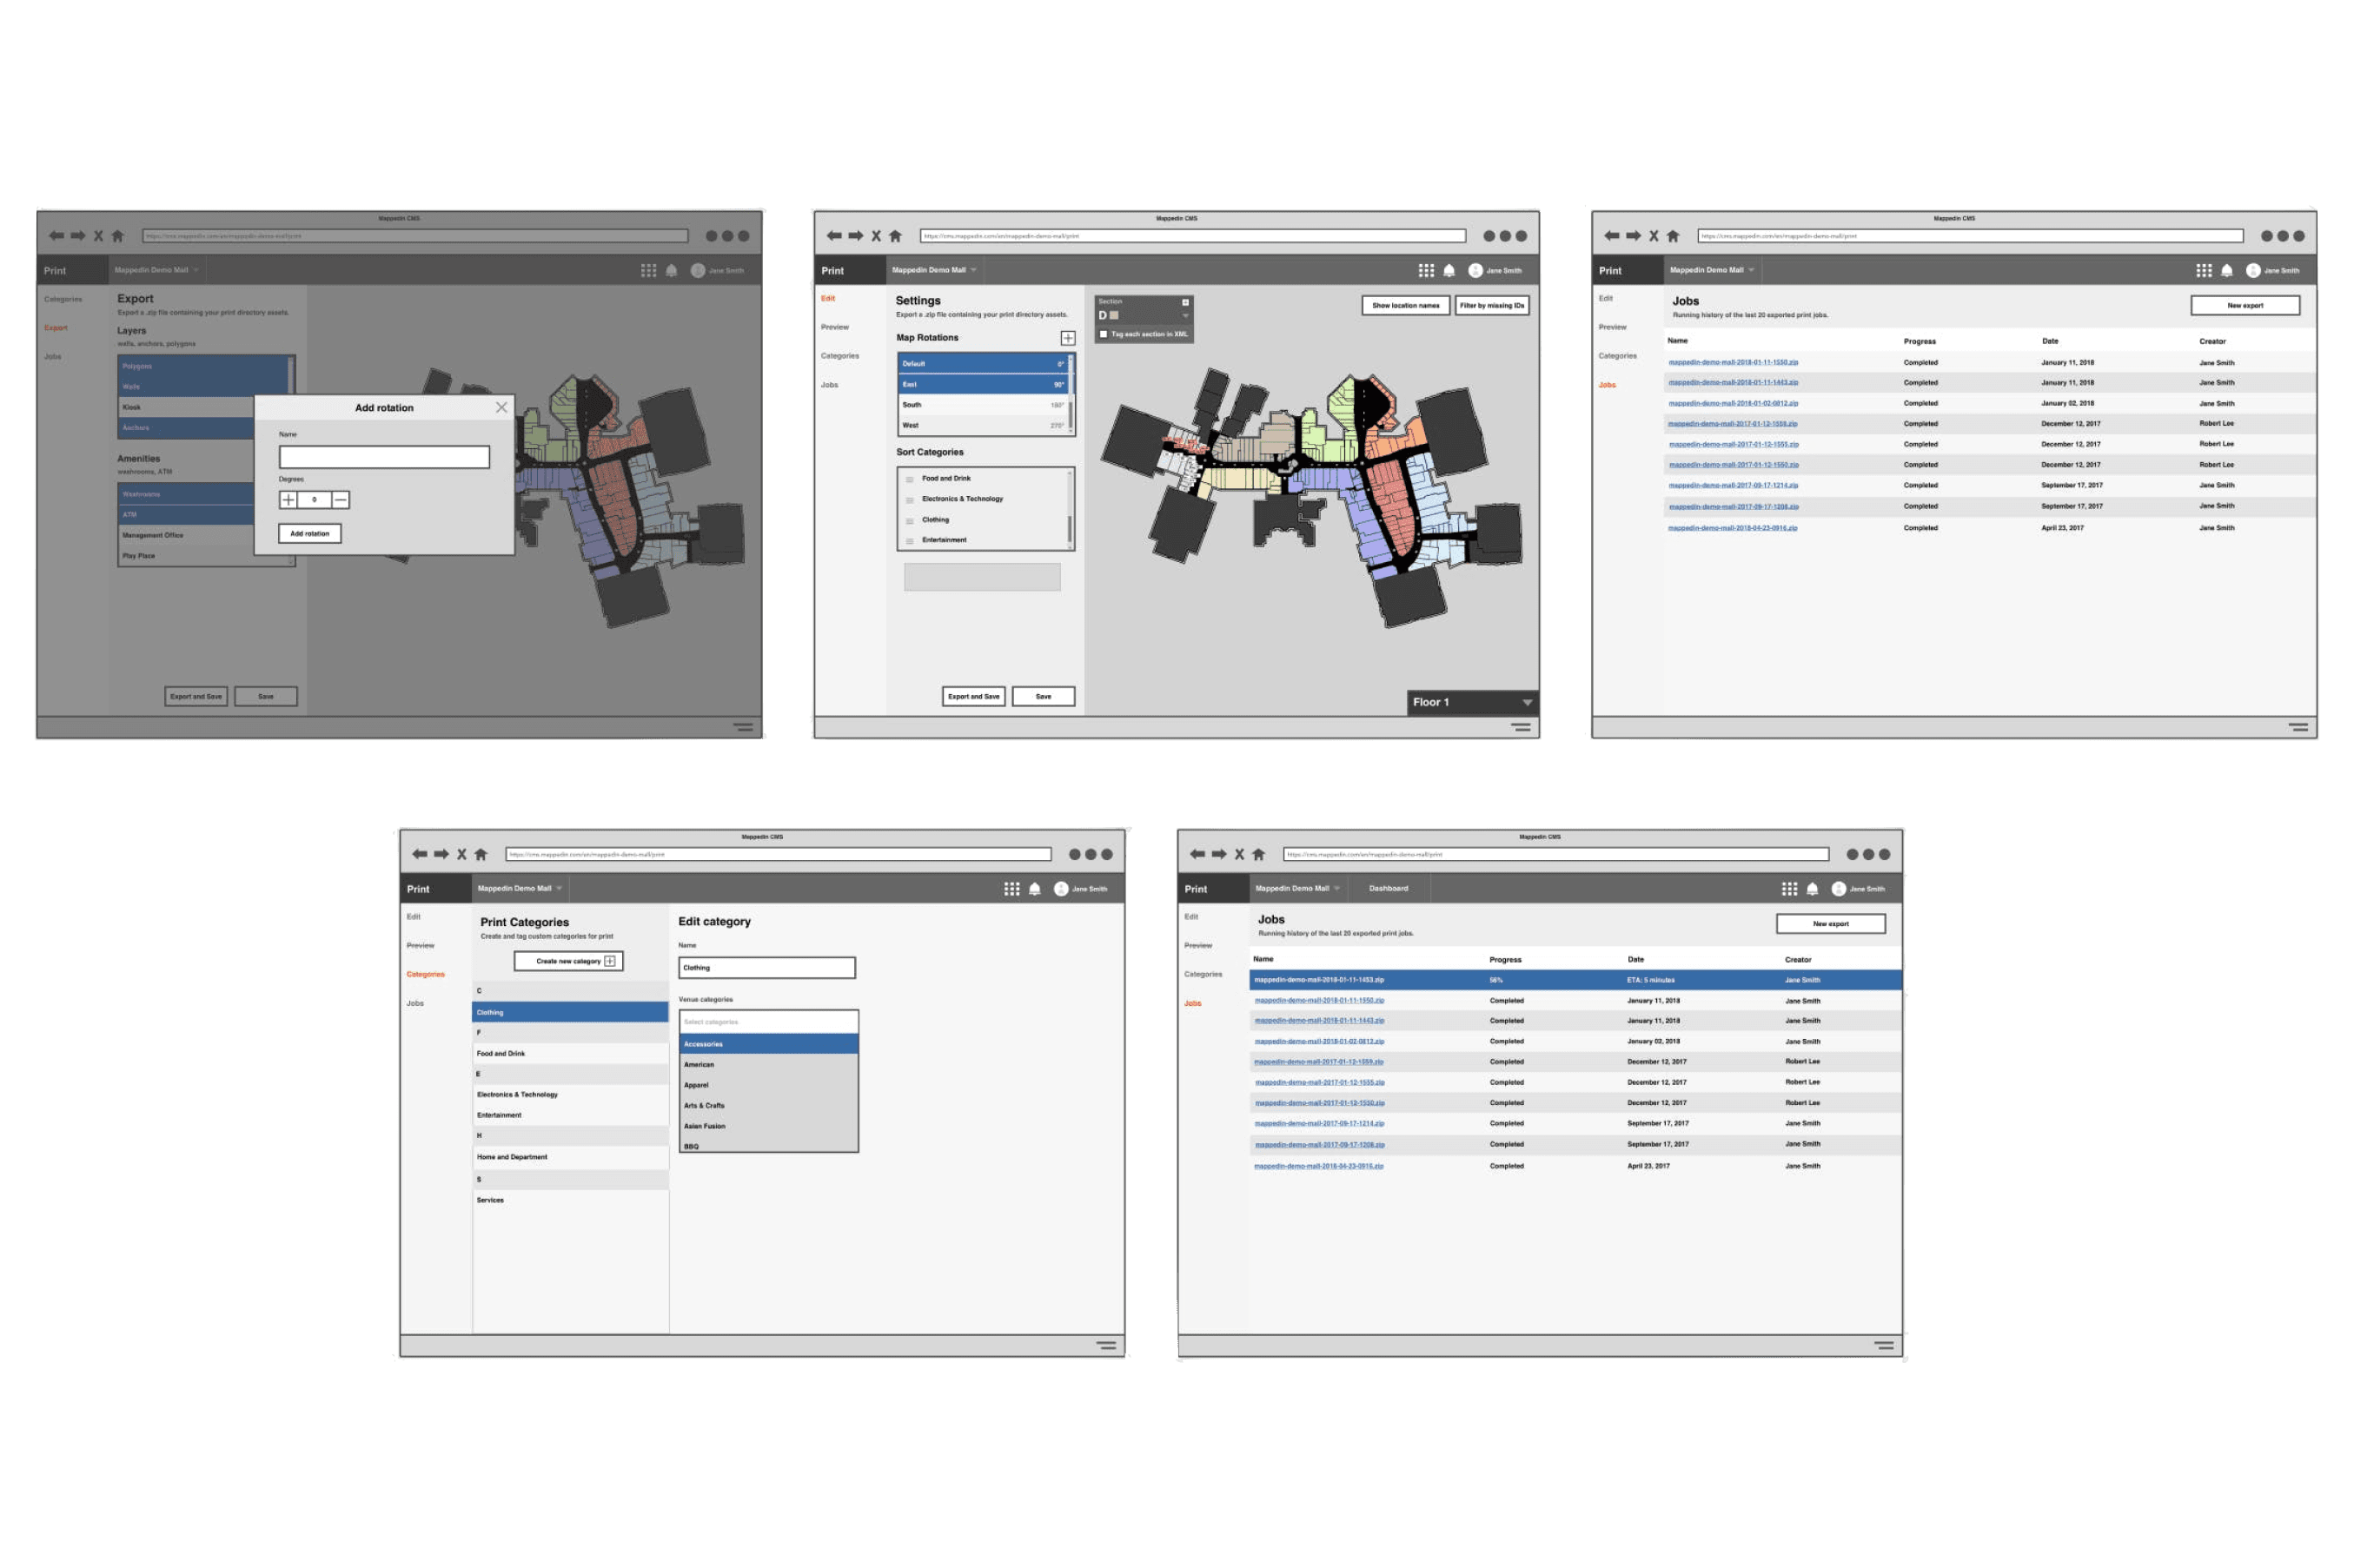
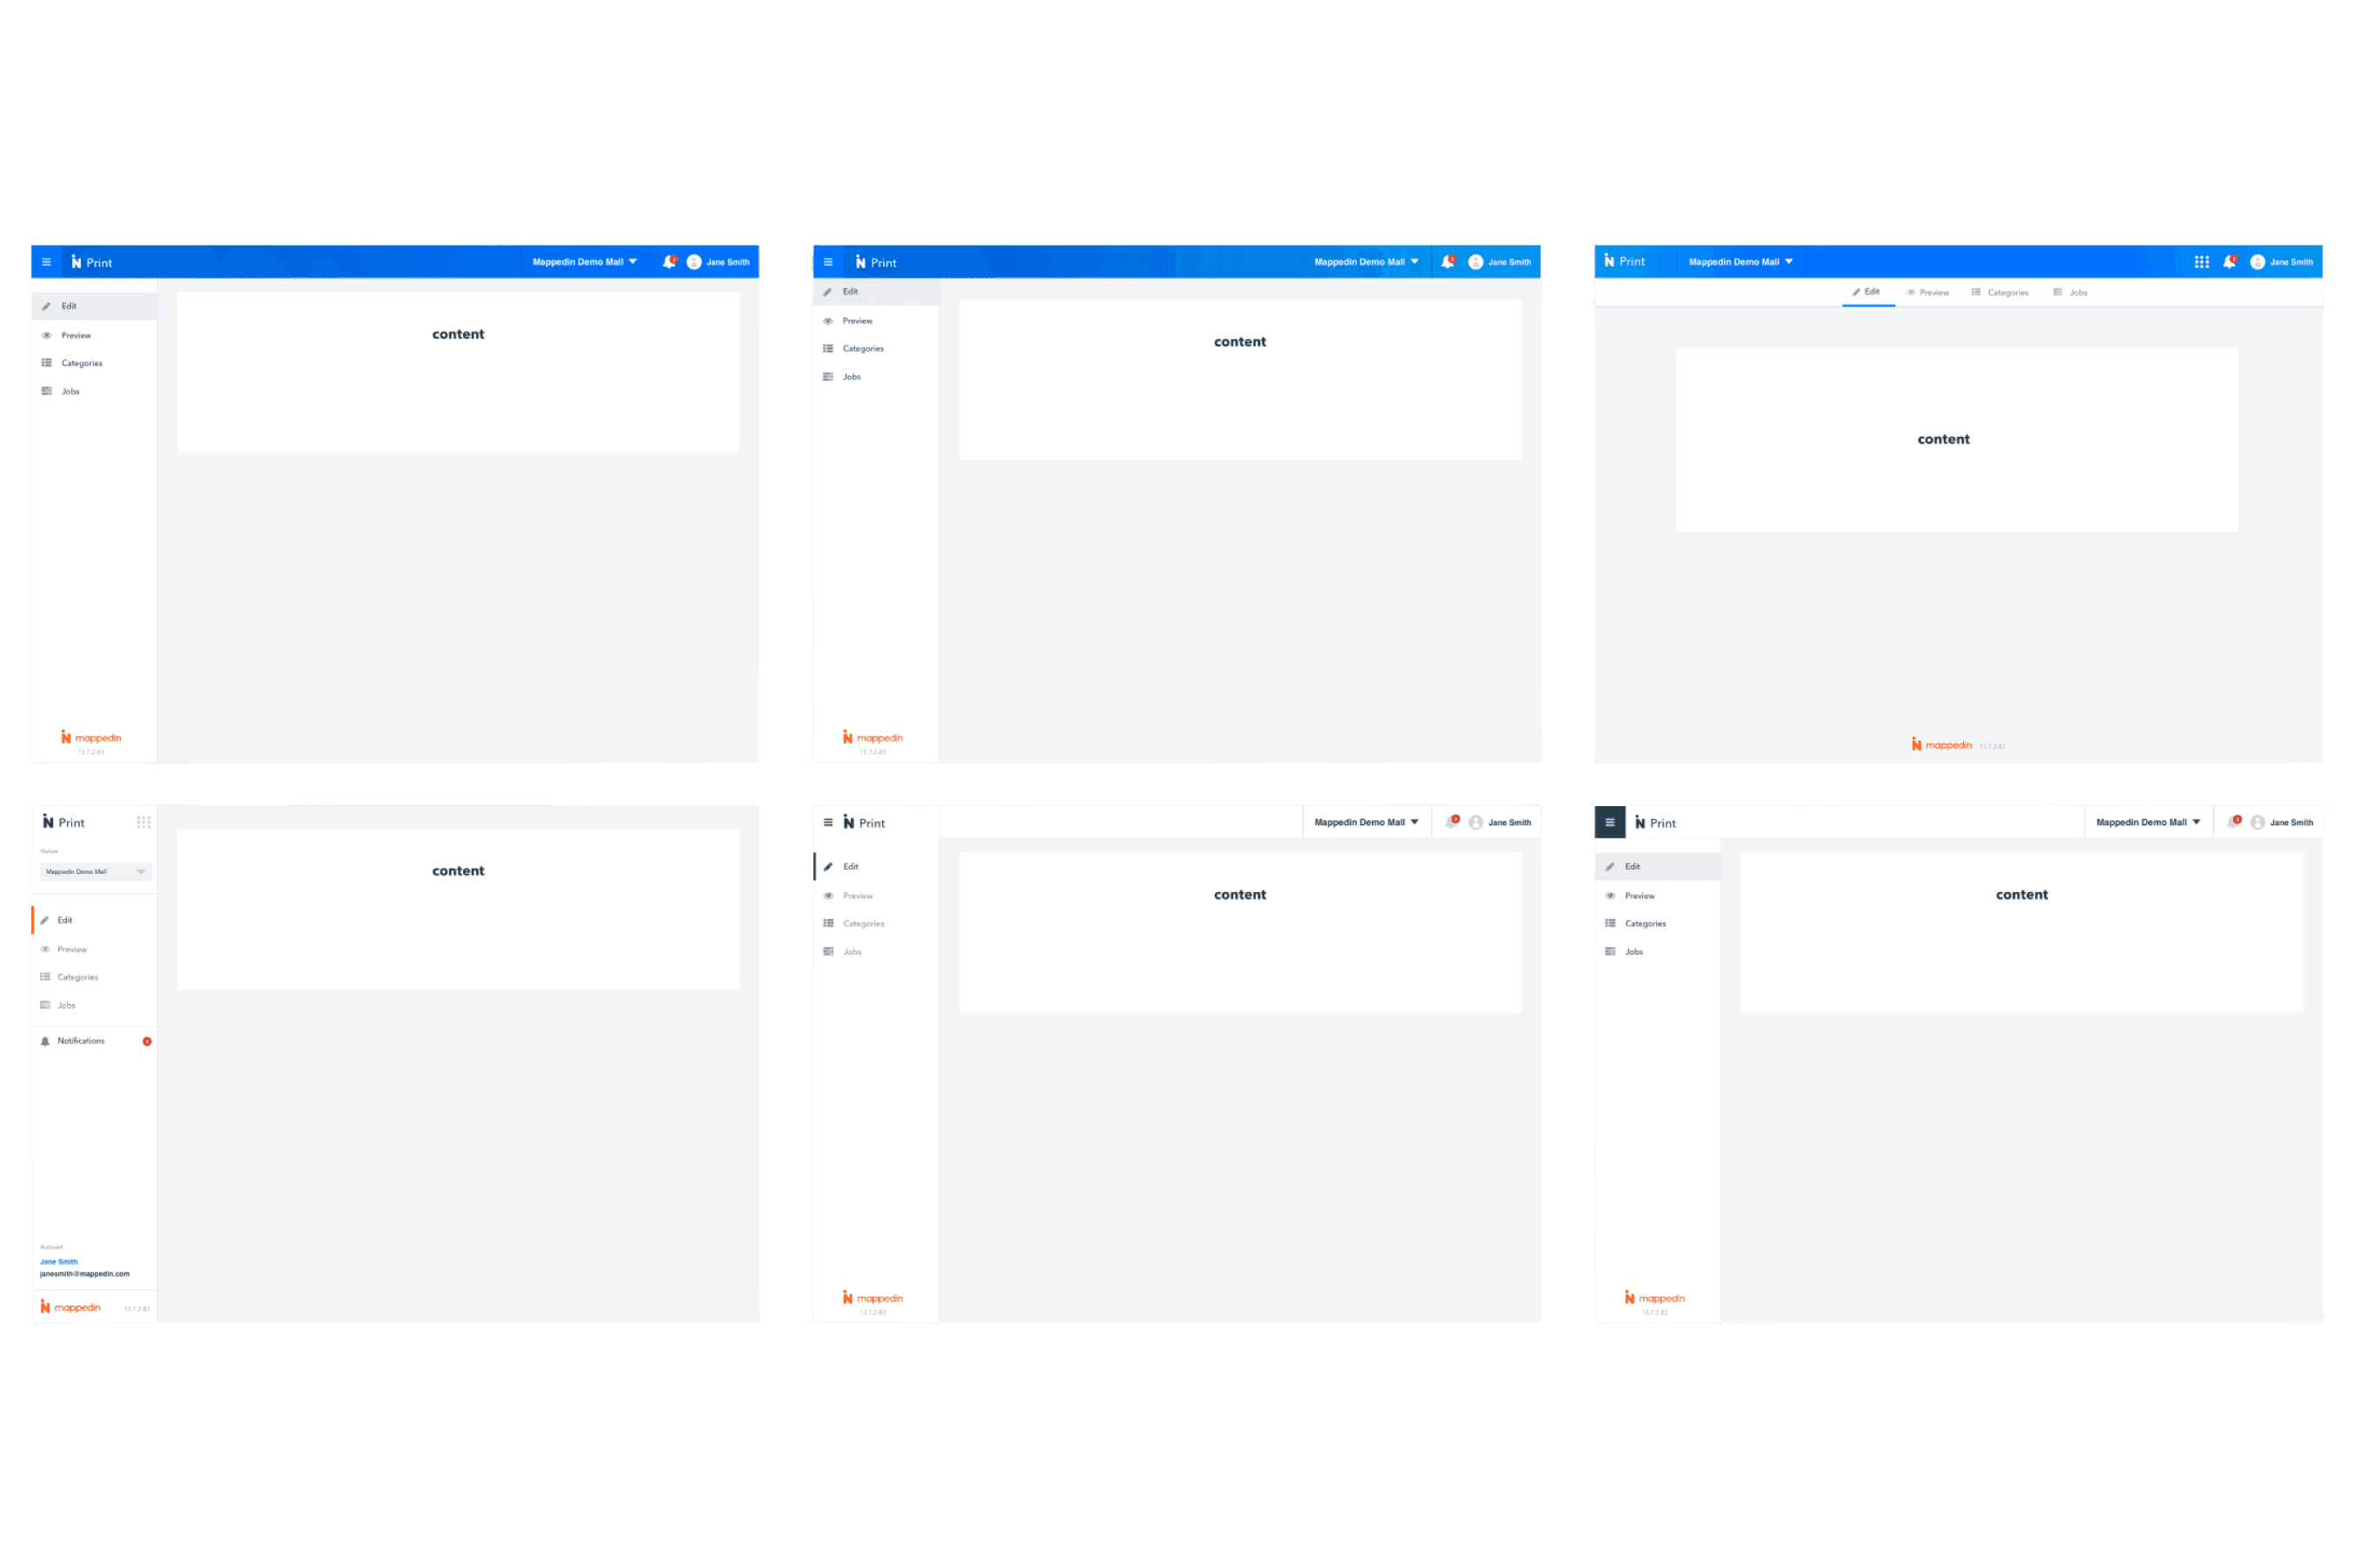
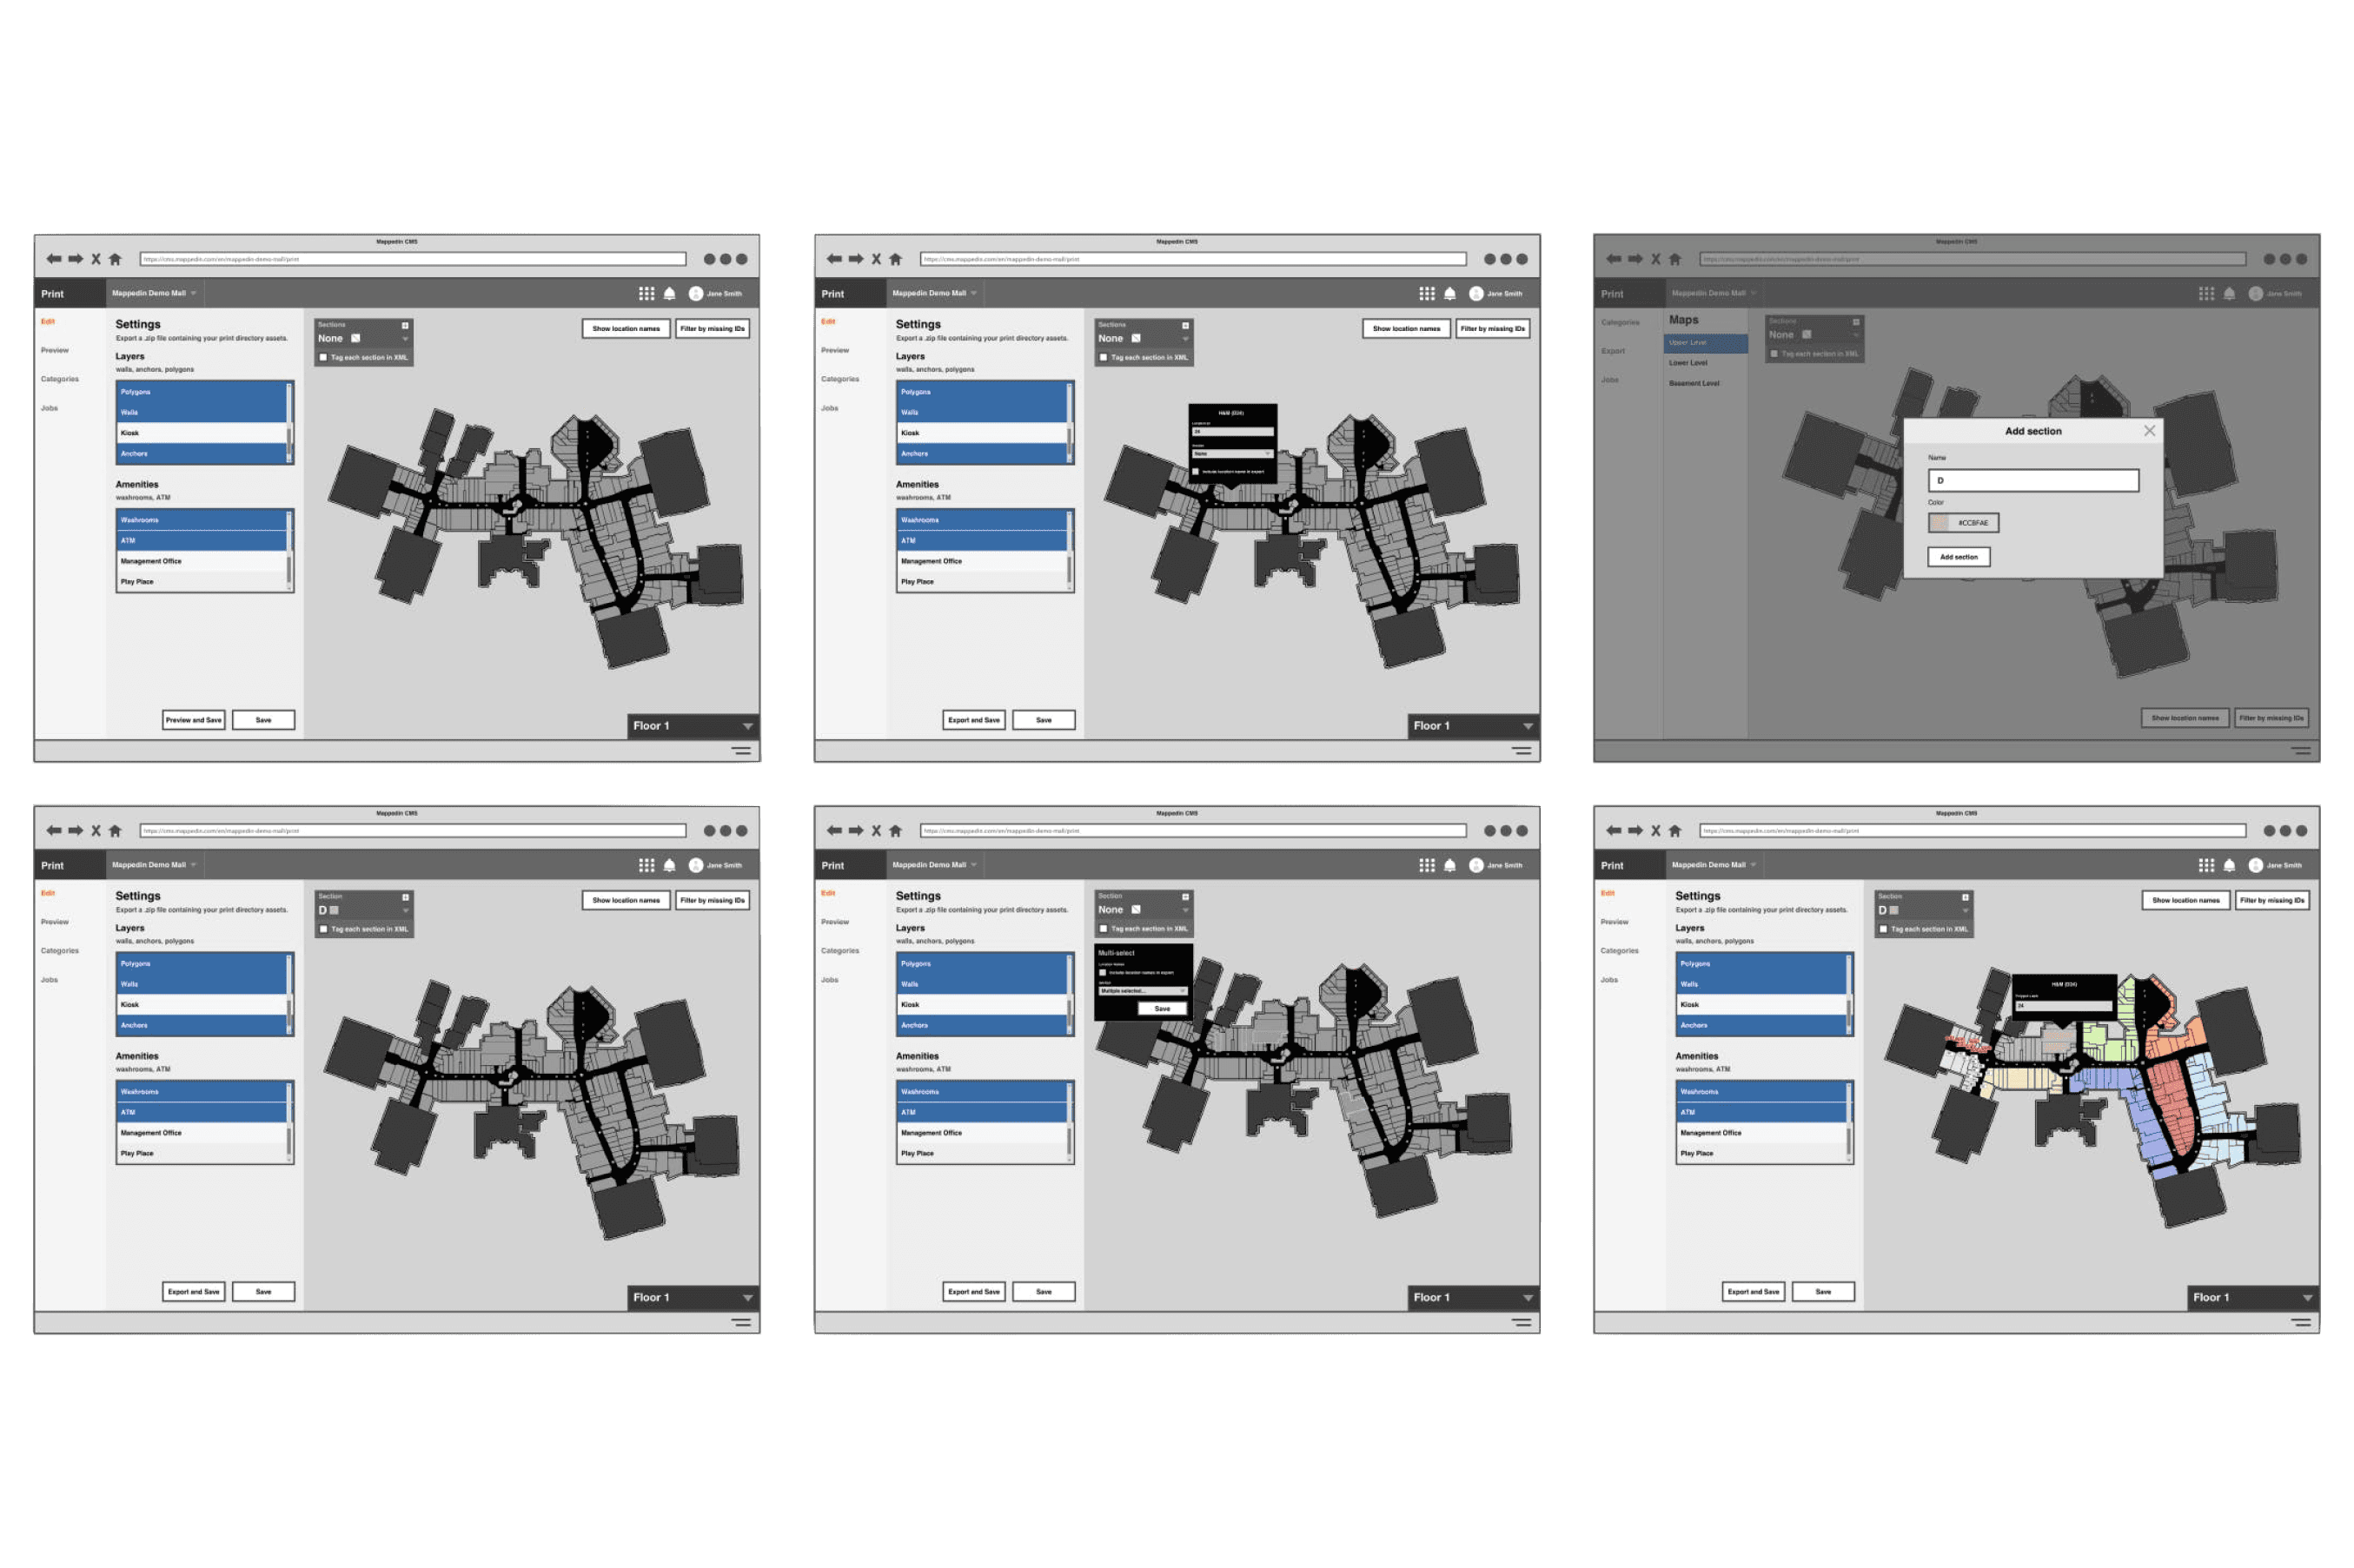
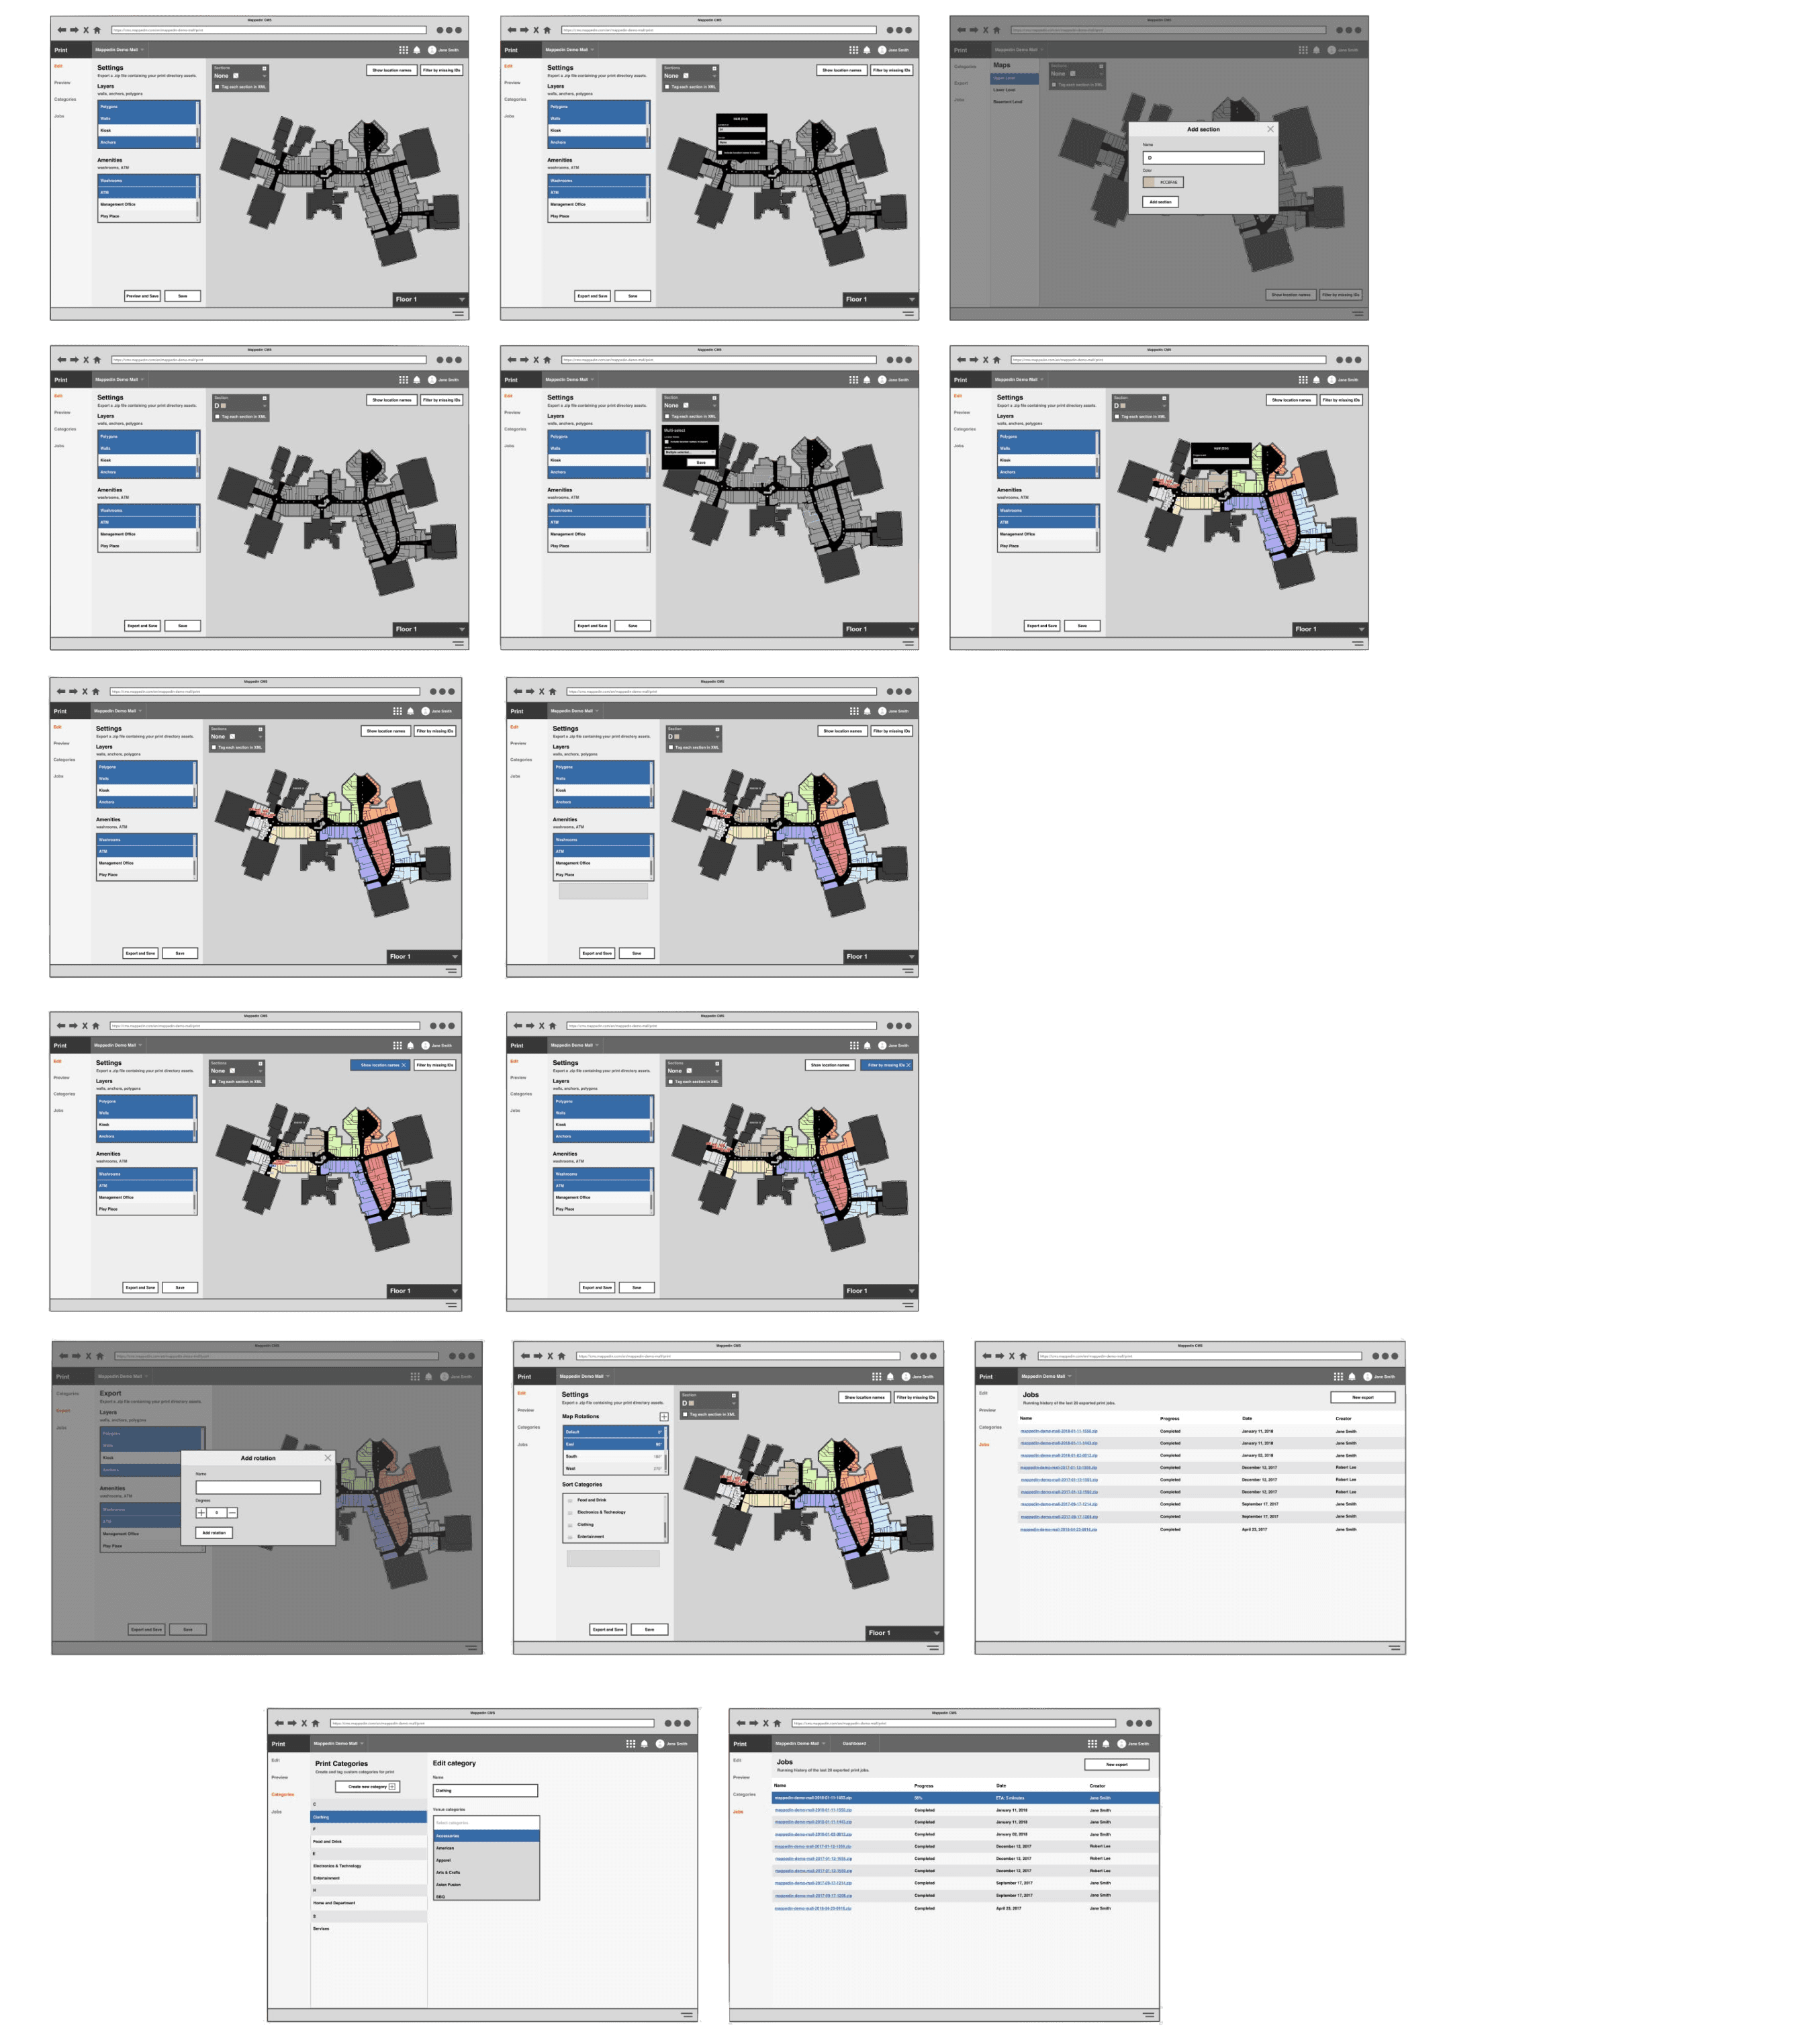
Low-fidelity prototypes helped us test labelling and layouts with pilot customers. We refined the map-editor interactions in parallel with the technical approach so the system stayed useful rather than merely automatic.
Refinement and release
We tested exported files with design teams to ensure they worked in Adobe InDesign, then used customer feedback to refine the workflow before a broader launch.
Challenges
Digital maps can progressively reveal details; printed maps have one fixed size. A venue's dozens—or hundreds—of granular digital categories would overwhelm a directory. Dense retail units often could not fit a readable store identifier inside their polygon. Maps also had to change orientation without hours of manual repositioning.
Finally, fully automatic output was not enough. Professional designers needed editable files in familiar applications, so the export format and document structure mattered as much as the visual result.
Solutions
Three coordinated, editable files
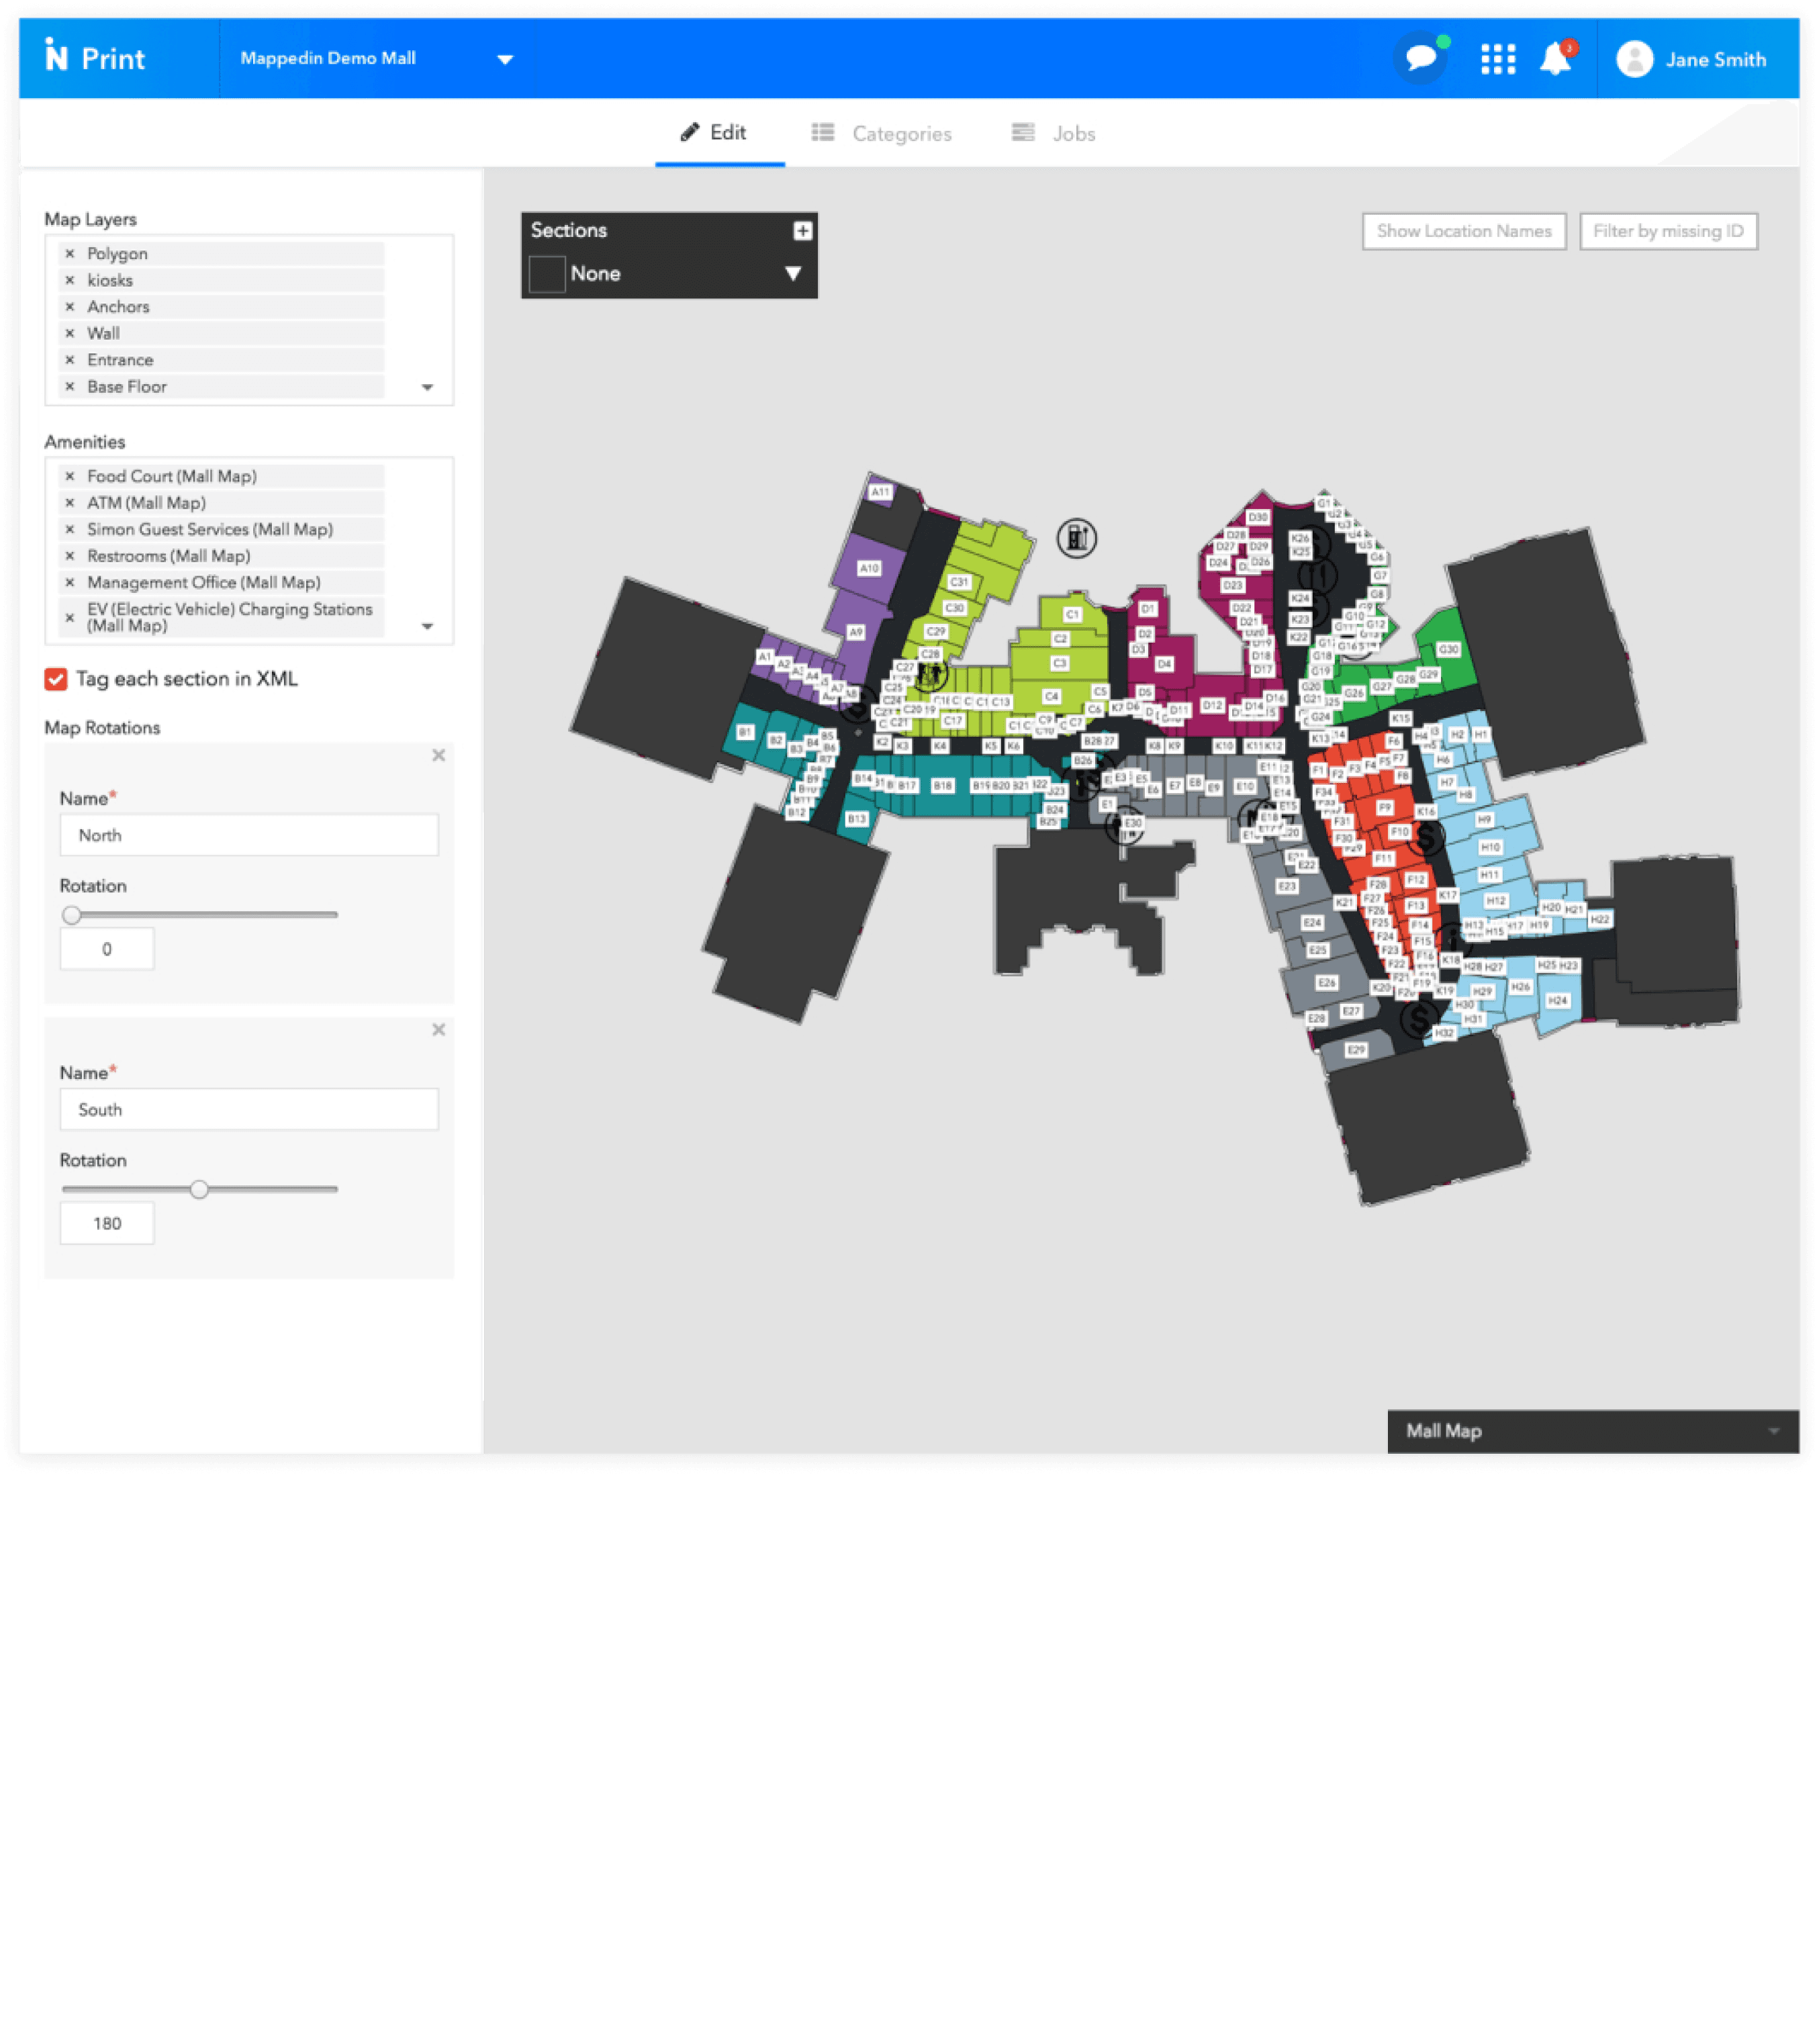
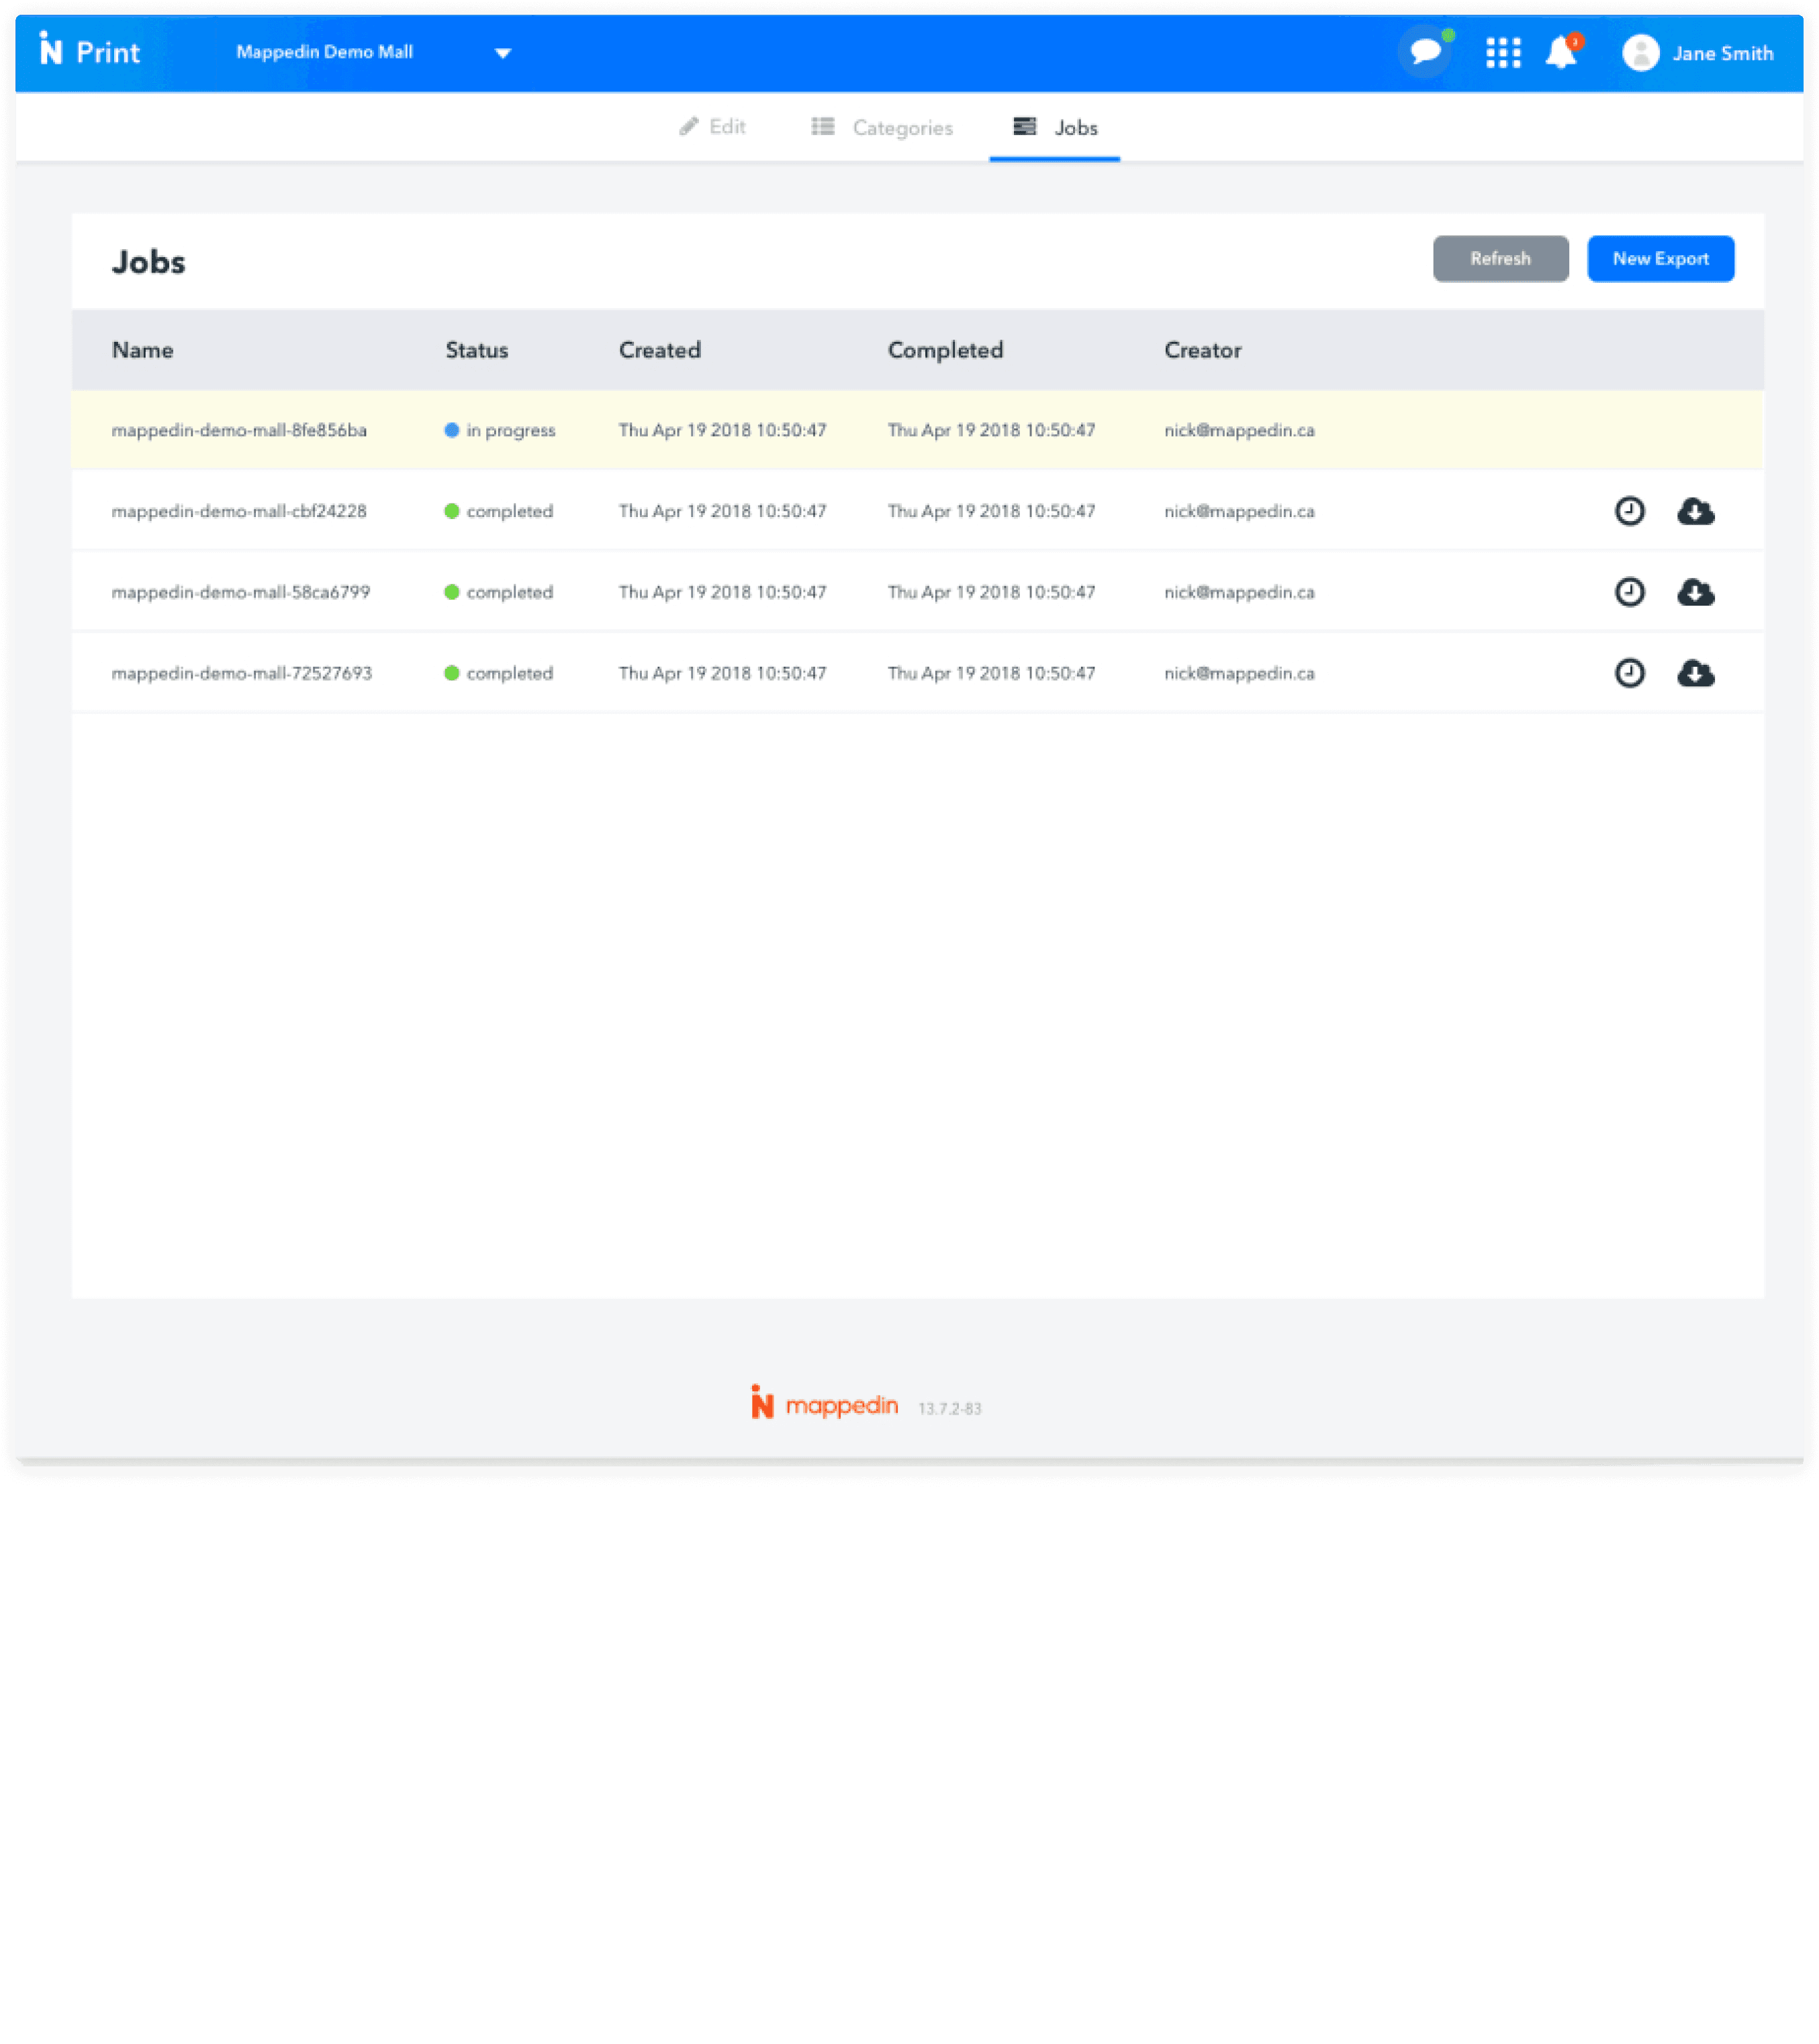
The system generated a PDF containing the vector venue map, an SVG containing identifiers and icons, and an XML file containing directory-listing text. Together they kept data coordinated while allowing production teams to refine the final design.
A manageable category system
An interface mapped detailed venue categories into simpler print categories and warned users whenever a digital category had not been assigned. This kept printed information consistent without carrying over unnecessary complexity.
Intelligent identifiers and callouts
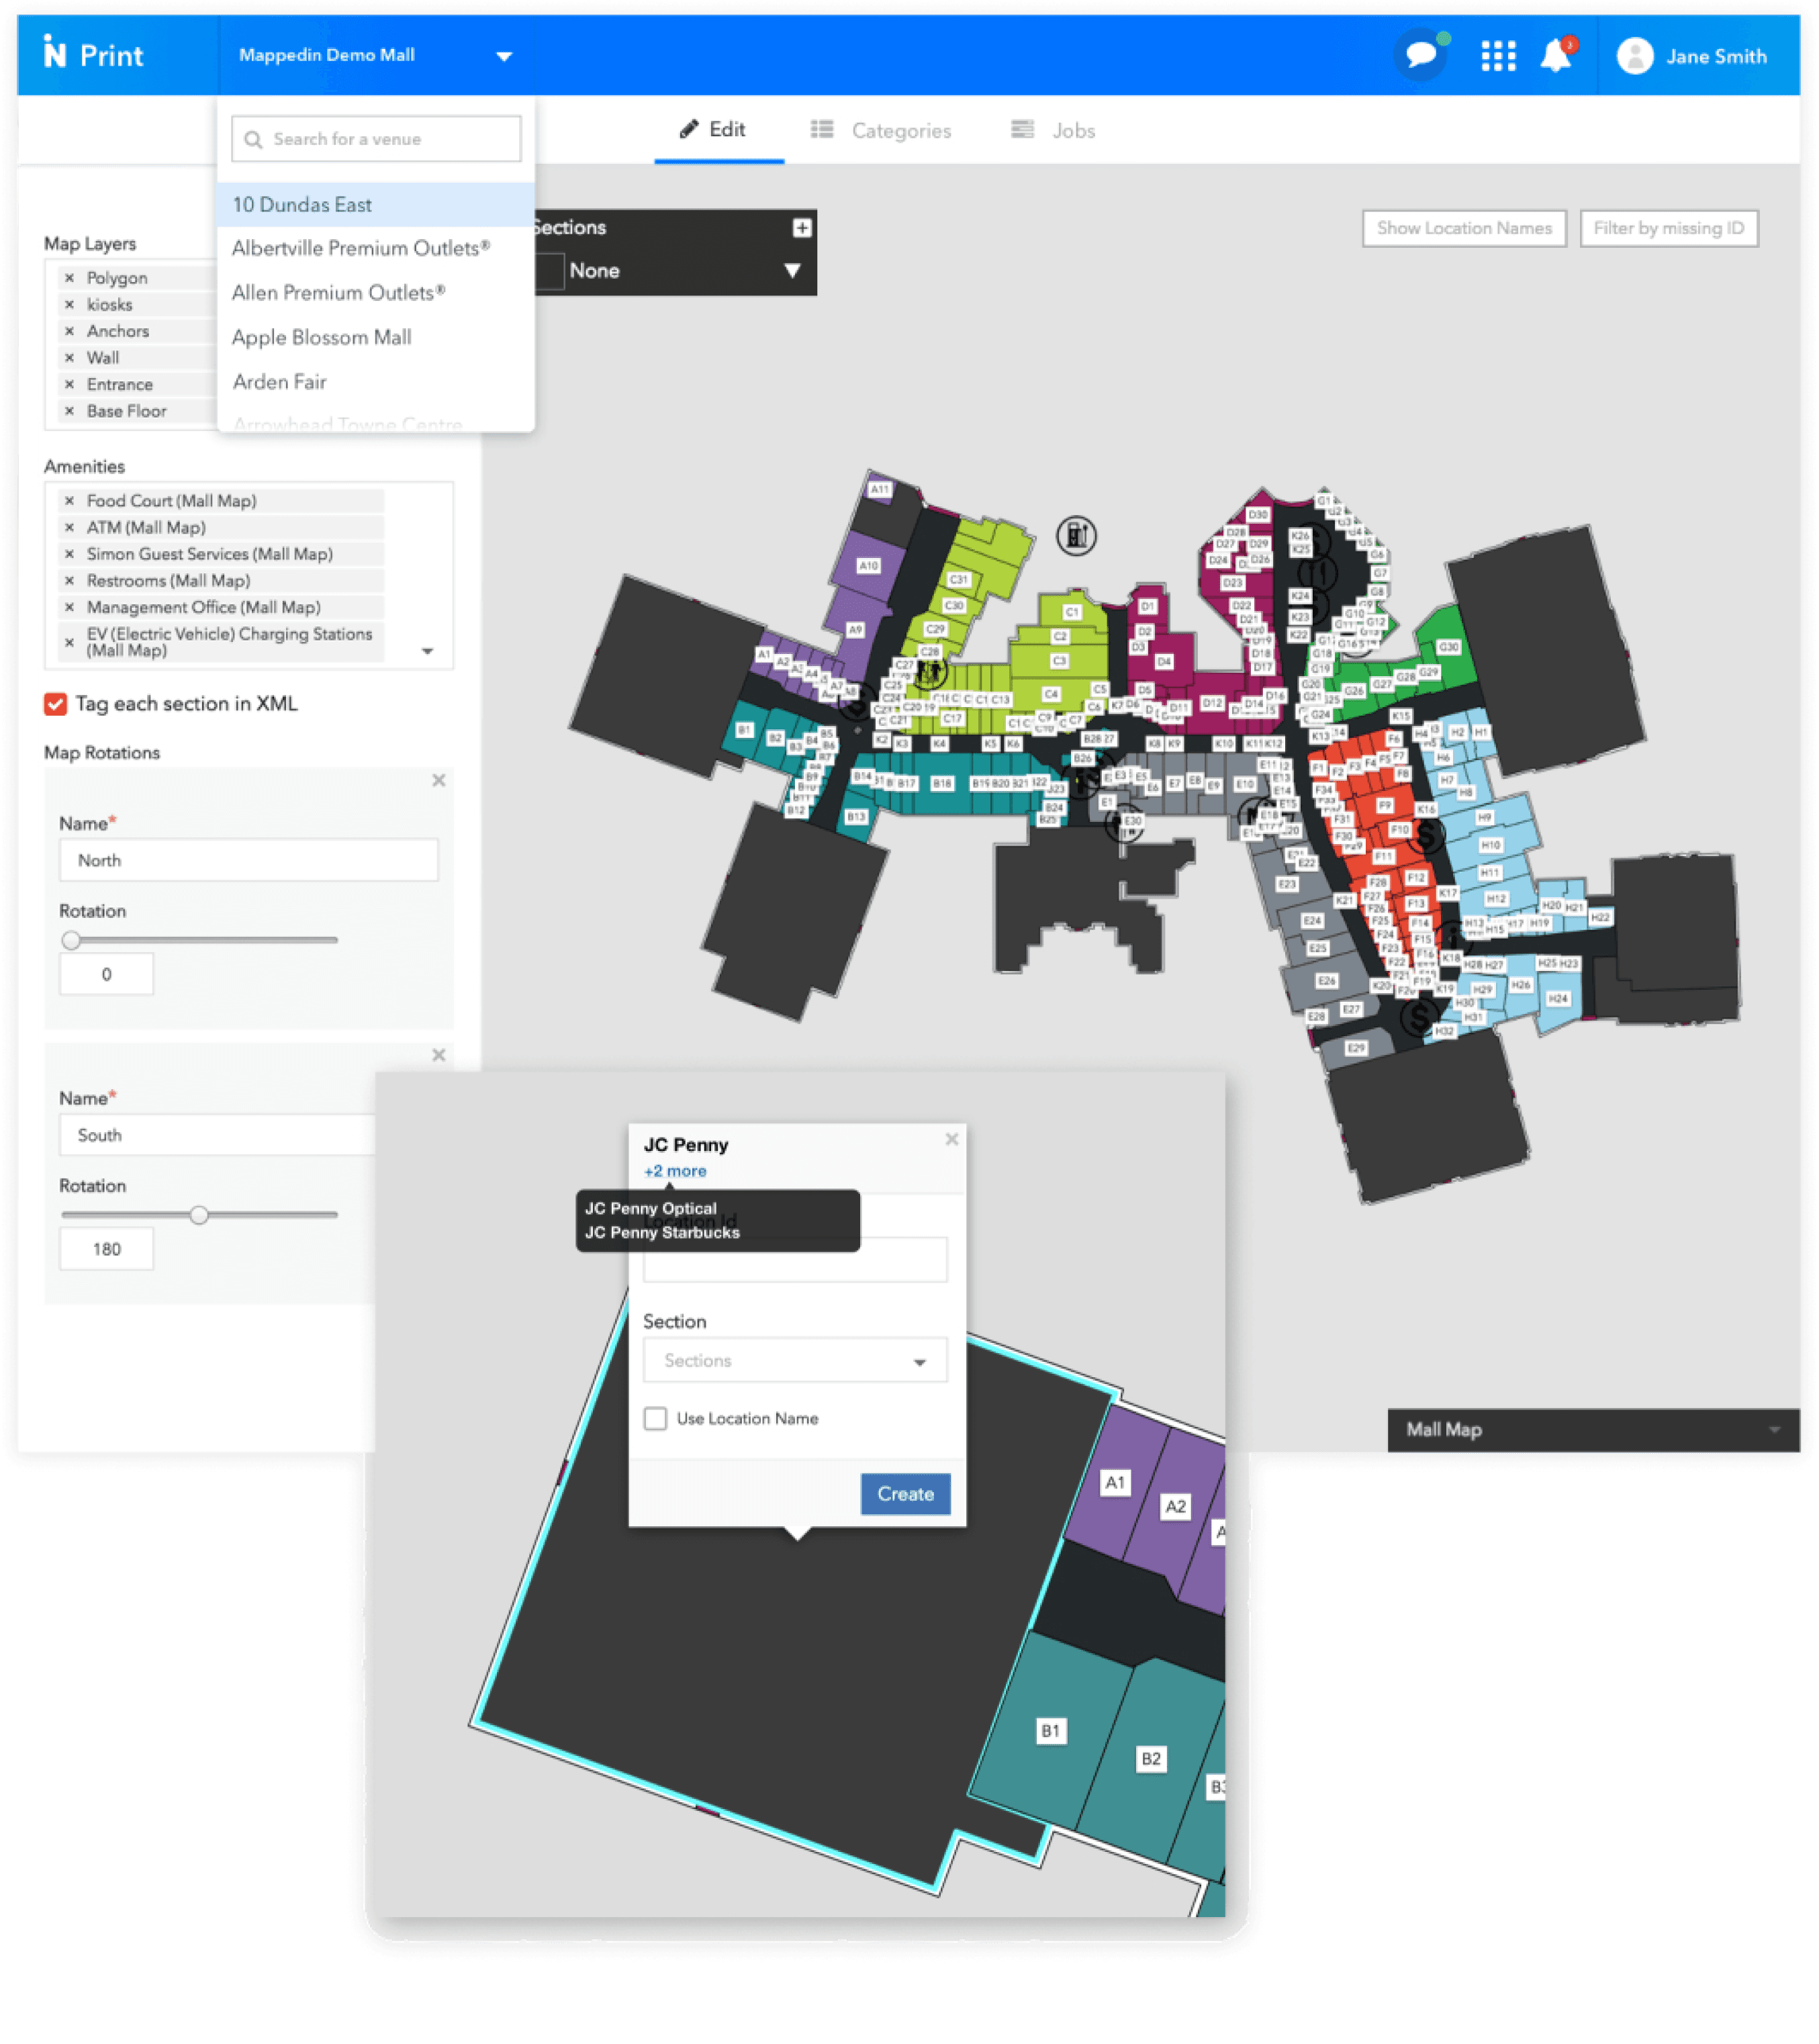
Placement considered the physical unit size, whether it sat in a special or high-traffic area, and the available polygon space. When an identifier could not fit legibly, the system created a callout with a lead line automatically.
Control over density
Layer controls let people choose which units, amenities, obstructions, and other facility elements appeared in the final map. Designers could reduce information density without disconnecting the output from the venue data.
Logical sections
Map elements could be grouped into sections, making visually distinct areas of a large facility easier to organize and style.
Final notes
Mappedin Print bridged the digital and physical parts of the customer journey. Existing map data could now produce a consistent, updateable set of print assets in half the previous time.
The project reinforced a broader lesson: the product ecosystem extends beyond the screen. Solving the complete customer problem sometimes means designing the bridge into their existing tools and physical environments, not asking them to abandon either one.